
Figure 3.
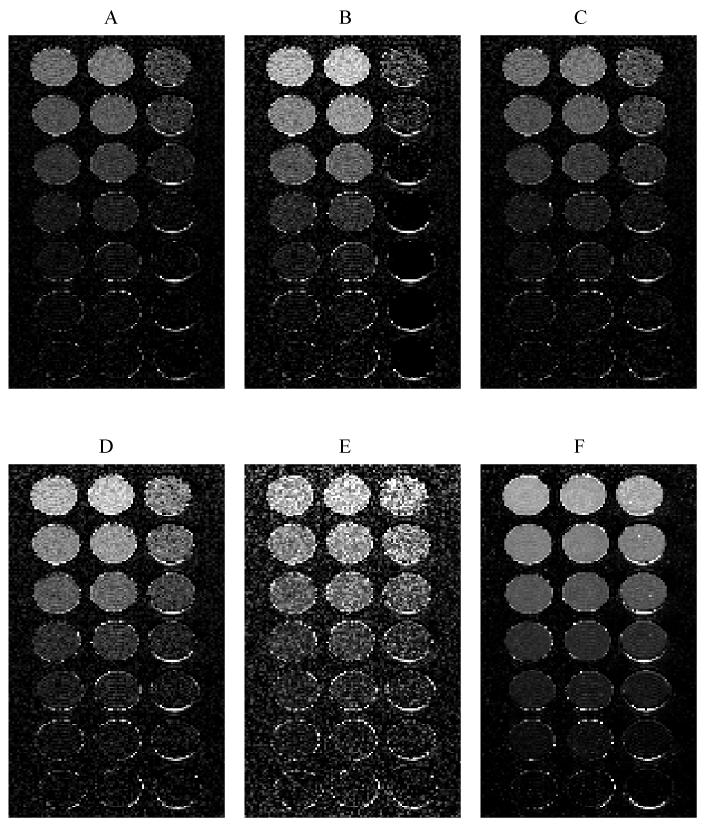
Panels (A) to (F) show fat fraction maps estimated using models (i) to (vi). Columns were doped with gadolinium (left), no agent (middle) and ferumoxides (right). The known fat fractions are 20.0, 14.9, 9.8, 4.7, 2.5, 1.1 and 0 %. The images are windowed identically between 0 and 30% therefore the rows should appear iso-intense.