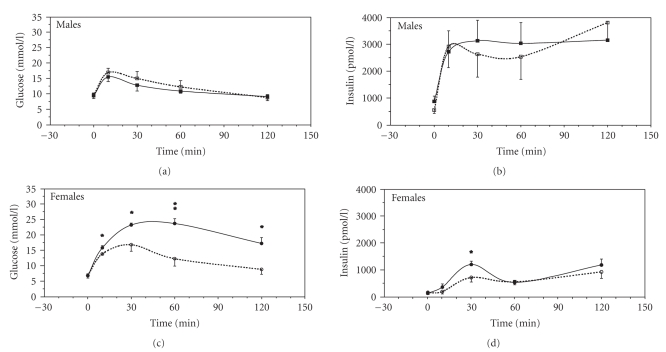
Figure 1.
Plasma insulin and glucose levels immediately before and at different timepoints after an intraperitoneal injection of glucose (1 g/kg body weight) in anaesthetized, nonfasted nontransgenic (NT, dotted line), and hIAPP transgenic mice (solid line) on a high-fat diet for 14 months. Mean values and SEM are shown; n = 5–11 per group of mice; statistically significant changes between hIAPP and NT mice are indicated by *(P < .05) and **(P < .01).

