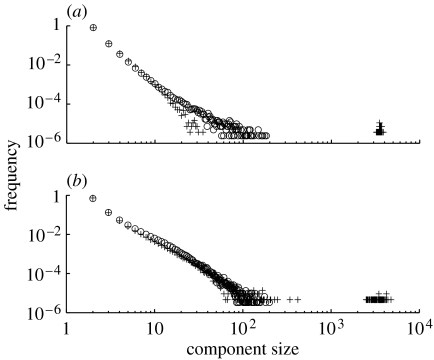
Figure 3.
Component size distributions below (circles) and above (pluses) the percolation threshold for (a) assortatively mixed and (b) disassortatively mixed networks. In disassortatively mixed networks, above the percolation threshold, component sizes are larger than those of assortatively mixed networks. The parameter values used here are N=10 000, γ=2.5 and K is varied to increase link density.

