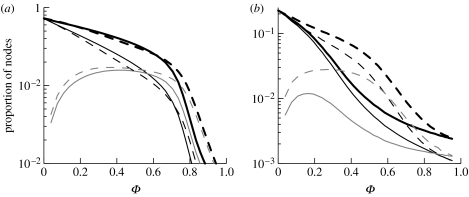
Figure 6.
Epidemic properties of disassortatively (solid lines) and assortatively (dashed lines) mixed networks. Final epidemic size (R(∞), thick black lines), the proportion of nodes that have become triggering nodes via clinical signs or screening (thin black lines) and the proportion of nodes that have been contact traced over the whole epidemic (grey lines) versus probability of tracing Φ=φ/(φ+δ). In (a), τ=0.125 and 0.175 are used on disassortatively and assortatively mixed networks, respectively. In (b), τ=0.0528 is used for both network types. Throughout, α=1/3.5 and δ=1/2.0.

