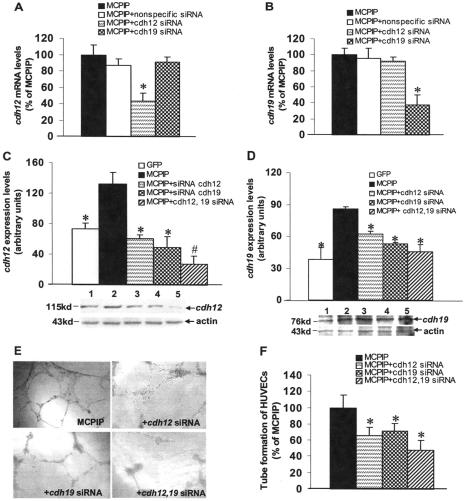
FIGURE 7.
Contribution of cdh12 and cdh19 expression to MCPIP-mediated angiogenesis. A and B, real-time PCR analysis of cdh12 and cdh19 mRNA in HUVECs transfected with the expression vector for MCPIP-GFP with or without cdh12- and cdh19-specific or nonspecific siRNA showed that only siRNA specific for the particular cdh gene showed knockdown. *, p < 0.05 versus MCPIP vector-transfected HUVECs. C and D, histograms depicting the average cdh12 and cdh19 expression levels in the examined groups shown in the Western blot. Lane 1, GFP; lane 2, MCPIP; lane 3, MCPIP+cdh12 siRNA; lane 4, MCPIP+cdh19 siRNA; lane 5, MCPIP+cdh12,19 siRNA. *, p < 0.05; #, p < 0.01 versus MCPIP vector-transfected HUVECs. E, phase-contrast photomicrographs (original magnification ×100) of HUVECs seeded on the surface of the polymerized fibrin gels for 24 h after transfection with MCPIP expression vector, MCPIP+cdh12 siRNA, MCPIP+cdh19 siRNA, or MCPIP+cdh12, 19 siRNA. F, mean number of tube branch points in randomly selected 5 high-power field (×100) of views were quantified and expressed as a percentage of MCPIP-treated group; *, p < 0.05 versus MCPIP vector-transfected HUVECs.

