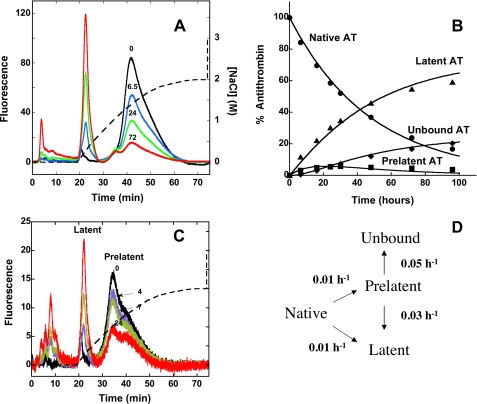
FIGURE 4.
Kinetics of conversion of native antithrombin to prelatent and latent forms. A, fluorescence elution profiles obtained after heating native plasma antithrombin at 60 °C in pH 7.4 citrate buffer for the indicated times (in h) and chromatographing 10 μg samples on the Hi-Trap heparin column as in Fig. 1 using the convex salt gradient (dashed line). The different forms of antithrombin eluting from the column were quantitated by integrating the areas under each peak, and the relative amounts of each form were expressed as a percentage of the total fluorescence. Further details are provided under “Experimental Procedures.” B, plot of the time dependence for conversion of native antithrombin (AT) (•) to prelatent (▪), latent (▴), and nonbinding (♦) forms based on the quantitation of these forms in the chromatograms of A and others not shown for clarity. The solid lines indicate the computer fit of data by the model in D along with the fitted rate constants as detailed under “Experimental Procedures.” C, chromatograms of isolated prelatent antithrombin after incubating at 60 °C in pH 7.4 Tris/citrate buffer for the indicated times (in h) and chromatographing on Hi-Trap Heparin with elution using the convex salt gradient (dashed line). Prelatent, latent, and unbound forms of antithrombin were quantitated by integration of peaks and normalizing to the total fluorescence as in A. D, minimal kinetic model consistent with the data of A–C together with the rate constants providing the best fit of the data by this model.

