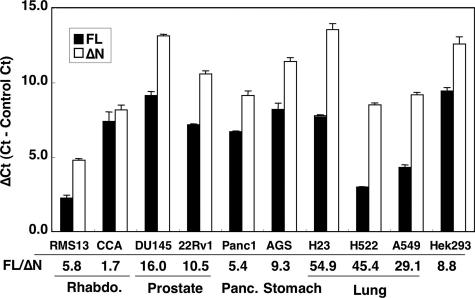
FIGURE 2.
Expression of GLI1FL and GLI1ΔN in tumor cell lines. GLI1FL and GLI1ΔN were quantified by real-time RT-PCR using SYBR Green. Data are presented as relative Ct (Cycle threshold, the cycle number at which the fluorescent emission reaches an arbitrary threshold) values (ΔCt), that is the Ct of GLI1FL or GLI1ΔN minus the average Ct of the housekeeping genes RPLP0, GAPDH, and TATA box-binding protein in each sample. The expression ratio of GLI1FL to GLI1ΔN is shown as FL/ΔN. The error bars indicate the standard deviation. The differences between the GLI1FL and GLI1ΔN values were statistically significant in all but the CCA cell line (p < 0.001, analysis of variance, Bonferroni test).

