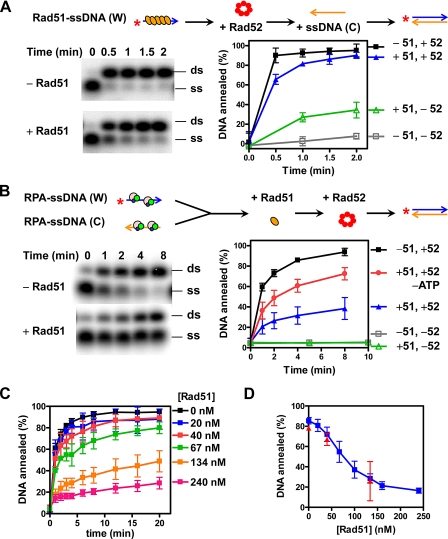
FIGURE 1.
Rad51 inhibits Rad52-mediated DNA annealing. The reactions were conducted as described under “Experimental Procedures” and are illustrated schematically at the top of the figure. Rad51 inhibits Rad52-mediated annealing of complementary ssDNA (A) and RPA-ssDNA complexes (B). A representative gel of Rad52-promoted DNA annealing is shown in the left panel, and the quantification is shown in the right panel. The reactions contained Rad52 alone (-51, +52; black squares), both Rad51 and Rad52 (+51, +52; blue triangles), neither Rad51 nor Rad52 (-51, -52; gray squares), and Rad51 alone (+51, -52; green triangles). ATP was omitted from the experiment represented by red circles. The results are the averages obtained from at least three independent experiments, and the error bars represent one standard deviation (where absent, the error bars are smaller than the symbol). C, time course of Rad52-mediated DNA annealing as a function of Rad51 concentration (gels not shown). The extent of DNA annealing at 4 min is plotted versus the Rad51 concentration and is shown in D as blue squares; the red triangles are from experiments where Rad51 and Rad52 were incubated together and added simultaneously. The results are the averages obtained from at least two independent experiments, and the error bars represent the variation.

