Figure 4.
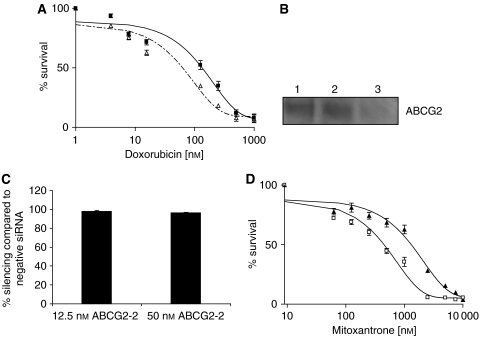
ABCG2 confers resistance to 21 nM single-step doxorubicin-selected clone. (A) Cytotoxicity assays using doxorubicin to evaluate the effect of inhibiting ABCG2 in the 21 nM single-step clone with 5 μM FTC. Dose–response curves were derived from six independent experiments using the CCK-8 assay for 21 nM cells with 5 μM FTC (▵) and without 5 μM FTC (▪). The mean values from six independent experiments are shown with error bars as s.e.m. (B) Western blotting analysis of ABCG2 protein using BXP-21 antibody following no treatment (lane 1), 50 nM negative siRNA treatment (lane 2) and 50 nM G2-2 siRNA treatment (lane 3). (C) Examination of two concentrations of siG2-2 siRNA on silencing of ABCG2. Levels of ABCG2 following siRNA treatment were analysed using the QuantiGene Reagent System (Panomics). Levels were normalised to cyclophilin B (PPIB) mRNA and results reflect the average and s.d. (n=5). (D) Cytotoxicity assays using mitoxantrone to evaluate the effect of silencing ABCG2 in the 21 nM single-step clone. Dose–response curves were derived from six independent experiments using the CCK-8 assay for 21 nM cells with 12.5 nM siG2-2 siRNA (□) and 21 nM cells with 12.5 nM siNeg (▴). The mean values from six independent experiments are shown with error bars as s.e.m.

