
Figure 1. Triangle plot showing the ancestry estimates.
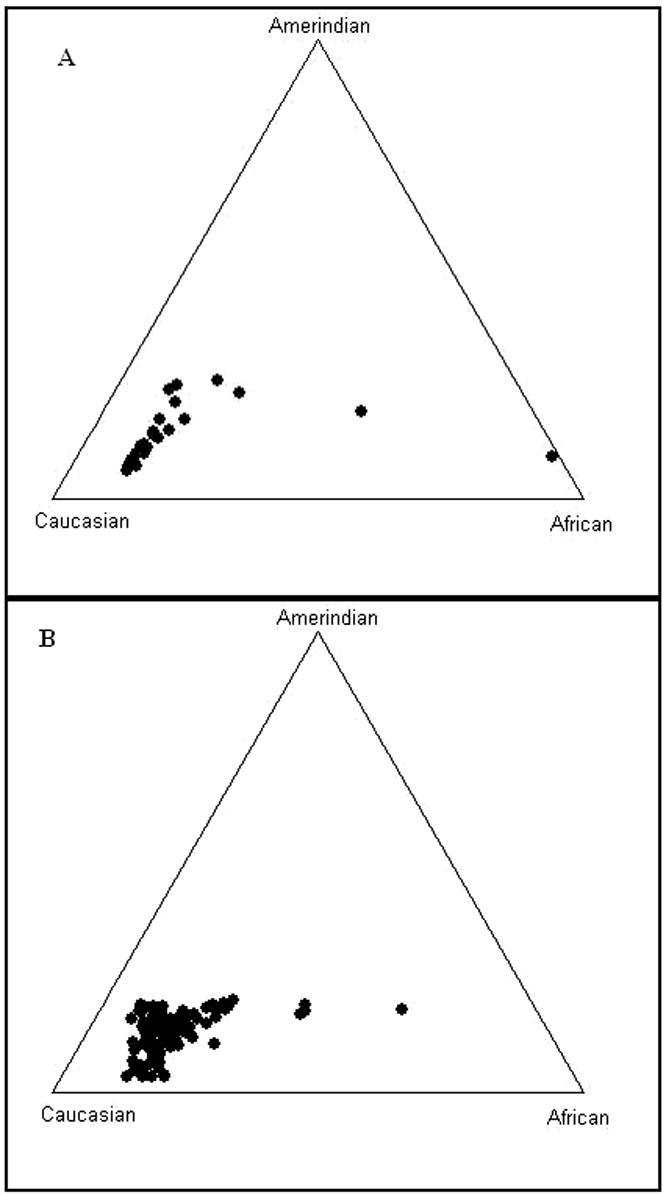
A) HCV spontaneous clearance (SC) Puerto Rican patients (N=39) (73.5% Caucasian, 15.4 % African and 11.1% Amerindian), and B) HCV chronic viremic (CV) Puerto Rican patients (N=121) (75.3% Caucasian, 14.2% African and 10.5% Amerindian) using a panel of 15 STR and 3 SNP unlinked markers with the maximum likelihood method and the computational program Structure 2.0. The parental populations are represented in each corner of the triangle. The circles represent individuals; which were clustered and distributed according to the ancestral proportion of the subject.