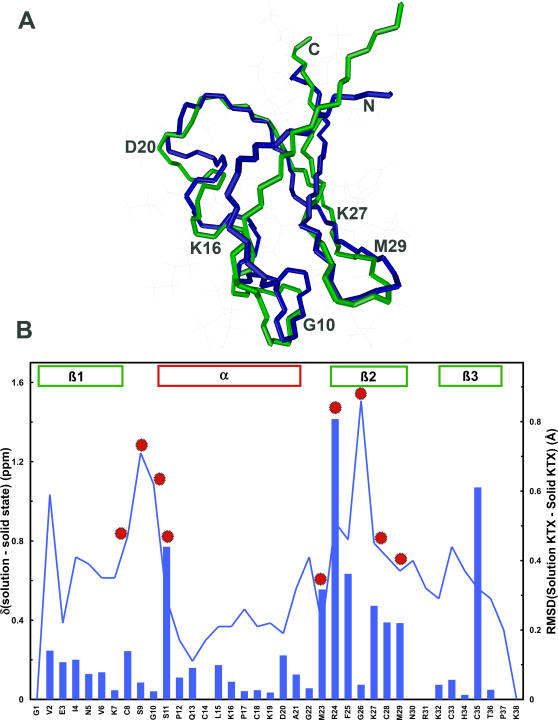
Figure 4.
(A) Superposition of high-resolution solid-state structure (green) and solution structure (blue; PDB code: 2KTX) of KTX. (B) Comparison of averaged Cα/Cβ chemical shift differences (blue bars; calculated according to 0.256*[ΔδCα2+ΔδCβ2]1/2) with rms deviation between the mean structures (blue line) of KTX in solution and in the solid-phase. Red dots mark residues, for which the backbone dihedral angles predicted by TALOS differ in solution and the solid state. Secondary structure is indicated.

