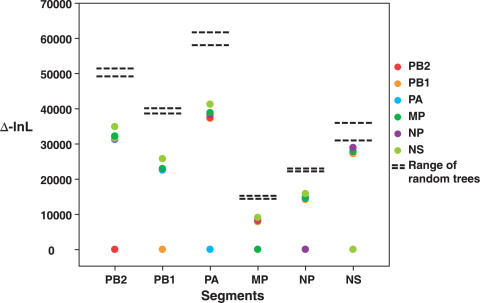
Figure 3. Maximum likelihood analysis of congruence among the internal gene segments of 407 isolates of avian influenza virus.
Each column represents the difference in log likelihood (Δ-lnL) between the ML trees of each gene (shown by colored dots). In every case, the ML tree estimated for the reference gene has the highest likelihood, while lower likelihoods (greater Δ-lnL values) are observed when the ML trees for the other genes are fitted to the sequence data from the reference gene and branch lengths re-optimized. To assess the extent of similarity in topology among genes, 500 random trees were created for each data set and their likelihoods assessed for each gene in turn using the same procedure (indicated by horizontal bars). In every case, and most notably for NS, the trees inferred for each gene have likelihoods closer to the random set than to the ML tree for the reference gene, indicative of extensive incongruence.

