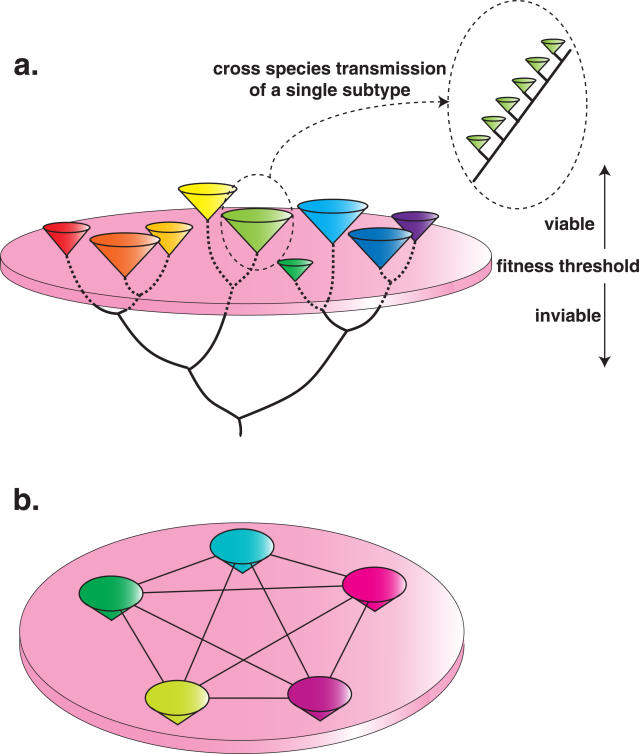
Figure 4. The fitness landscapes of avian influenza virus.
(a) The fitness landscapes observed in HA, NA and NS, and represented here by NA. Each colored cone represents an individual subtype. These subtypes are connected by a bifurcating tree. The lack of ‘intermediate’ subtypes – those falling below the pink disc – reflects major valleys in fitness, such that any virus falling in this area will experience a major reduction in fitness, most likely due to an elevated cross-protective immune response. Occasionally, individual subtypes jump species barriers and spread in new hosts (such as humans), where they experience a continued selection pressure and hence accumulate amino acid substitutions in a progressive manner, as shown. (b) The fitness landscapes observed in the remaining internal protein segments of avian influenza virus – PB2, PB1, PA, NP and M (represented by different colors). In this case, there is little functional difference among the genetic variants of each segment, so that the fitness landscape is flat. This equivalence in fitness among genome constellations also means that reassortment is frequent among them (as reassortants suffer no fitness cost), represented by the horizontal lines connected each internal gene segment.

