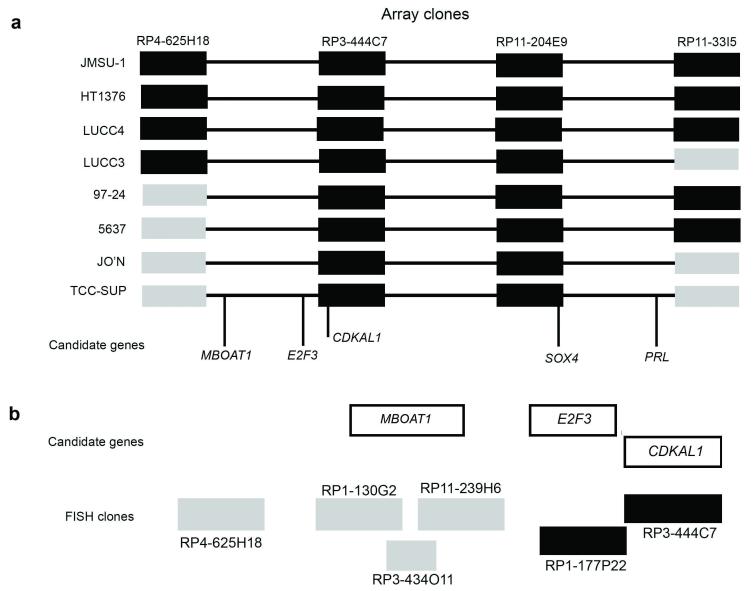
Figure 2.
Minimal region of amplification at 6p22 and candidate genes. Schematic representations illustrating (a) amplified and non-amplified clones in 8 bladder tumour cell lines with 6p22 amplification and candidate genes within a minimal region and (b) refinement of the minimal region distal to E2F3 using FISH. Amplified and non-amplified clones are represented by black and grey boxes, respectively.

