
Fig. 2.
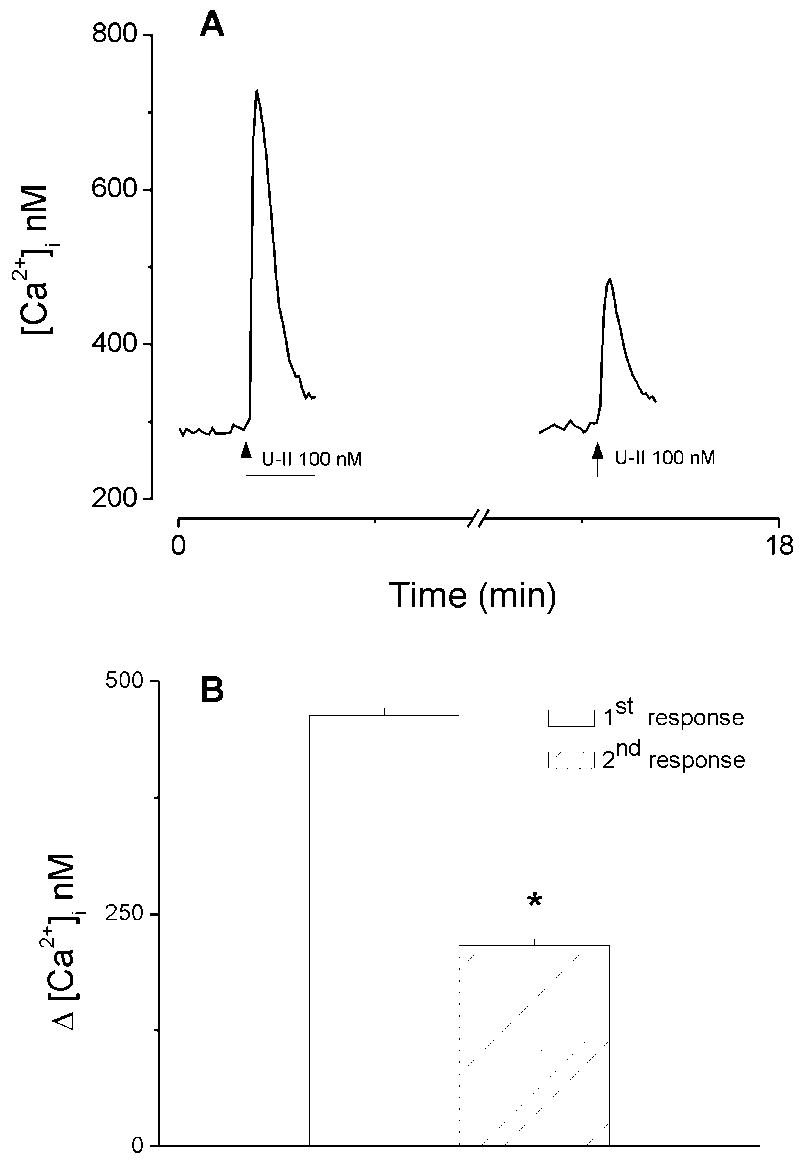
Ca2+ responses induced by two consecutive administrations of urotensin-II (U-II). A, Actual traces of two consecutive responses produced by superfusion of U-II (100 nM); the second superfusion consistently caused a much smaller increase in [Ca2+]i as compared to that produced by the first application. B, Comparison of the first and second response produced by U-II (100 nM): the first administration produced an increase in [Ca2+]i by 463 ± 8 nM, whereas the second administration produced an increase by 216 ± 7 nM (n=23). The asterisk denotes statistically significant difference as compared to the first response.