Figure 4.

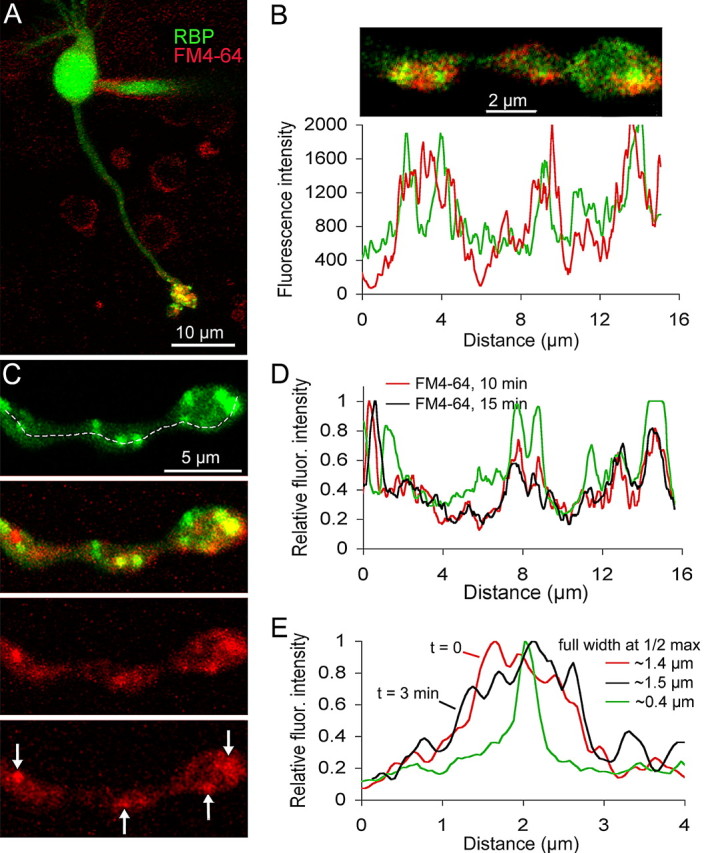
FM dyes taken up during synaptic activity concentrate near ribbons in live mouse bipolar terminals. A, Confocal image of a live bipolar cell loaded with FM4-64 (red) and Rpep (green). The peptide was dialyzed via a whole-cell patch pipette visible on the cell body. The image is the z-axis projection of a series of confocal optical sections through the entire cell. B, Single confocal optical section of a live bipolar cell terminal loaded with FM4-64 (red) and Rpep (green). Cell was loaded with FM4-64 ∼10 min before peptide dialysis and imaging. The graph below the image is the fluorescence intensity profile of the bottom half of the synaptic terminal (Fluoview software). The red trace indicates the fluorescence intensity of FM4-64, and the green trace indicates the fluorescence intensity of the peptide. C, Confocal image of a live bipolar cell axon and terminal loaded with FM4-64 (red) and Rpep (green). The top panel shows peptide labeling, and the panel just below it shows the overlay of the peptide and FM4-64 fluorescence. The bottom two panels show FM4-64 labeling ∼10 and 15 min after activity-dependent loading with FM4-64, respectively. Arrows in the bottom panel indicate clusters of FM4-64 labeling that remained stable over time. D, Fluorescence intensity profile along the dashed line shown in C for Rpep (green trace) and FM4-64 10 min (red trace) and 15 min (black trace) after activity-dependent loading. E, Fluorescence intensity profile through a single synaptic ribbon (green) and FM4-64 labeling taken at t = 0 min (red) and t = 3 min (black). The full-width at half-maximum of the ribbon fluorescence is ∼400 nm. The full-width at half-maximum of the cluster of FM4-64 fluorescence at 0 and 3 min is ∼1.4 and 1.5 μm, respectively.
