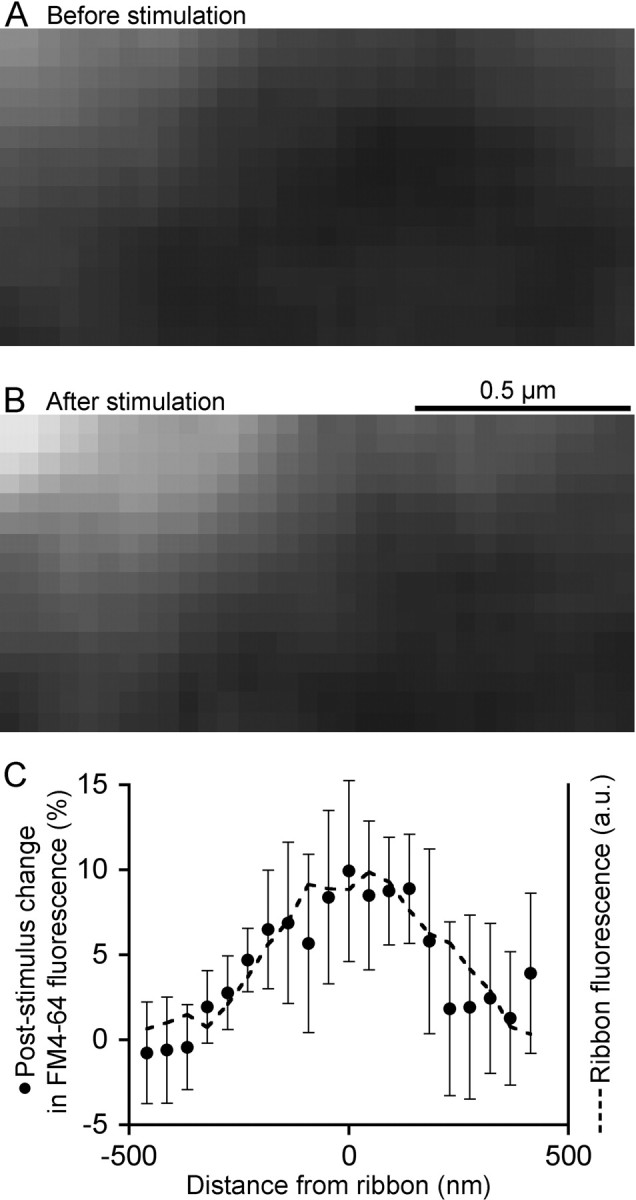
Figure 7.

Bleached ribbon-associated vesicles are replaced after a depolarizing pulse. A, Confocal image of FM4-64 fluorescence near a ribbon, located at the top left, after asymptotic recovery from a previous photobleach. B, Same region after a 500 ms depolarizing pulse. A and B are averages of 20 frames taken at 2 s intervals. C, Spatial profile of the average stimulation-induced change in FM4-64 fluorescence (filled circles) at eight photobleached ribbons with respect to ribbon position. The dashed line shows the profile of the average Rpep fluorescence to mark the ribbon position. Distance is measured from the center of the Rpep fluorescence peak. a.u., Arbitrary units.
