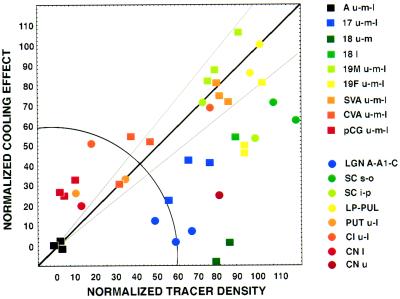
Figure 3.
Graph of normalized tracer density versus normalized cooling effect on 2DG concentration for a variety of cortical and subcortical structures. Normalization based on equating tracer density and decrease in 2DG uptake in contralateral auditory cortex to 0% and in the pulvinar nucleus to 100%. Solid line represents slope of unity that indicates that tracer density and effects on 2DG uptake are equal. Gray lines represents 20% deviation from these values. Squares represent cortical structures. Circles represent subcortical structures. The color-coded label for the different structures reflects levels of visual processing: blue, early; green/yellow, intermediate; and red, late. Radial distance represents connection strength, independent of measurement method, whereas polar angle (quarter circle) reflects the balance between functional (2DG) and anatomical (tracer) measurements of the connection. Points below the diagonal show a weaker 2DG effect than anticipated from the anatomy whereas points above the diagonal show a stronger 2DG effect than anticipated from the anatomy. Choice of another structure for normalization of measurements (e.g., area 17 rather than pulvinar) alters the number of points above and below the line but do not change the order of the points along the polar dimension. Hence conclusions are not affected by our choice of the pulvinar to equate functional and anatomical measurements. SVA, splenial visual area; 17, 18, areas 17 and 18; 19M, 19F, area 19 medial or fundal parts; Aud, auditory cortex; LP, lateral posterior nucleus; Pul, pulvinar nucleus; LGN A, A1 and C, lateral geniculate nucleus A, A1, and C subdivisions; PUT l and u, putamen lower and upper; CN l and u, caudate nucleus lower and upper; Cl l and u, claustrum lower and upper; SC s, o, i, and p, superior colliculus superficialis, opticum, intermediale, and profundum.

