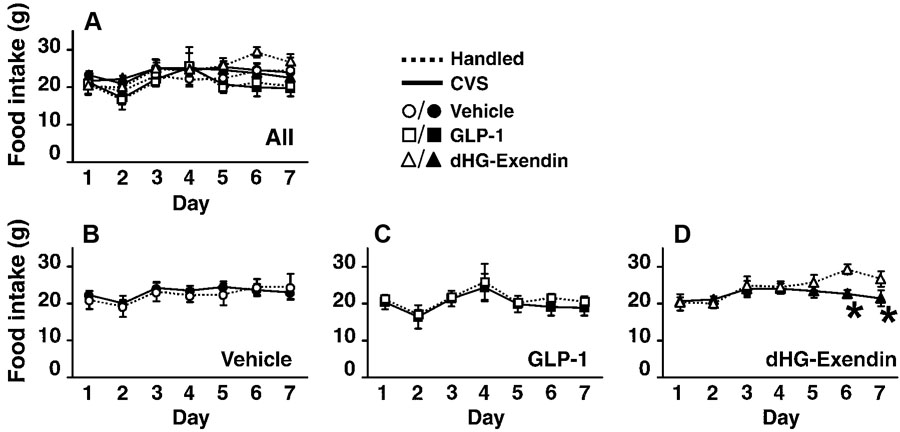
Figure 7.
Daily food intake (mean ±S.E.M., n=4–6). Figure 7A shows daily food intake of all 6 groups. Food intake in each drug treatment groups were compared in figures 7B–D to clearly depict the effects of chronic stress and drug treatment. CVS did not affect food intake within the control (B) or GLP-1 (C) treated animals, but decreased intake in dHG-exendin treated animals (D). *=p<0.05.

