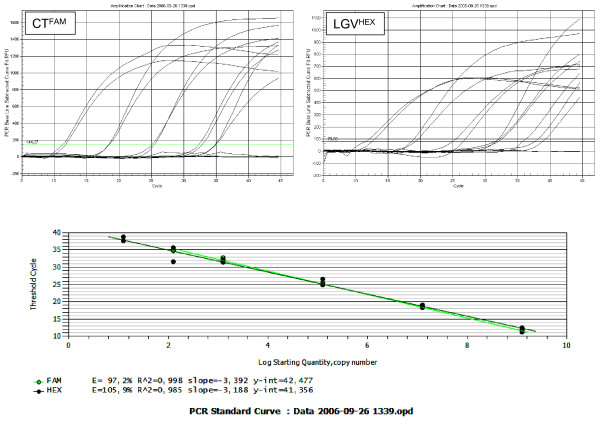
Figure 2.
Amplification charts and standard curves for the CT/LGV multiplexed real-time PCR. The linear range of the assay was determined using duplicates of 1.25 × [109, 107, 105, 103, 102, 101] copies of each cloned amplicon. The threshold values (Ct) were plotted against the corresponding copy numbers, and the efficiency, slope and linear regression correlation (r2) were calculated for each reaction by the Biorad IQ5 software.

