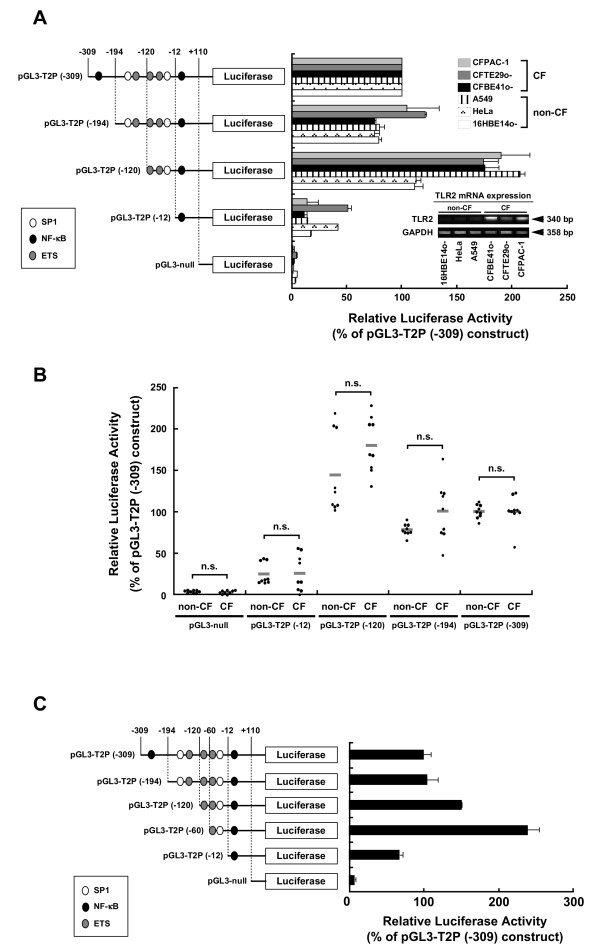
Figure 2.
Minimal region necessary for basal TLR2 promoter activity overlaps with the CpG sites adjacent to SP1 (CpG#18-20). (A) Deletion analysis of human TLR2 5'-regulatory CpG-rich region. 5'-serial deletion reporter constructs were transiently transfected into non-CF and CF epithelial cells. Luciferase activity is expressed as percent of the activity of pGL3-T2P (-309). Bar graphs represent the mean ± S.E.M. from 3 independent experiments performed in triplicate. TLR2 mRNA expression levels of each cell line are shown. (B) Comparison of non-CF and CF epithelial cell promoter activity in each deletion construct. Each data point represents luciferase activity in non-CF (16HBE14o-, HeLa, A549) and in CF (CFBE41o-, CFTE29o-, CFPAC-1) epithelial cells (n = 3 for each cell line). Mean values are represented as grey bar. The difference between non-CF and CF epithelial cells in promoter activity for each reporter construct was not significant (n.s.) as analyzed by Student's t-test. (C). Identification of the minimal region in the TLR2 promoter (-60/+110) necessary for basal TLR2 promoter activity. A series of 5' promoter deletion constructs were transiently transfected into HeLa cell to measure luciferase activity. Luciferase activity is expressed as the percent activity of the pGL3-T2P (-309) plasmid. Results are presented as the mean ± S.E.M. from three independent experiments performed in triplicate.

