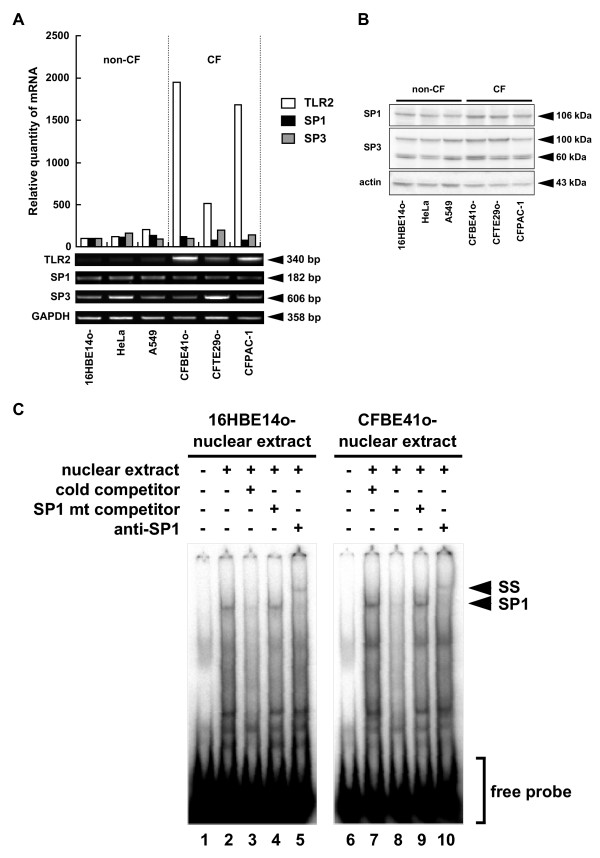
Figure 7.
SP1 expression in non-CF and CF epithelial cells. (A) SP1 mRNA expression in non-CF and CF epithelial cells. The levels of TLR2, SP1 and SP3 mRNA in the indicated cell lines were determined by semi-quantitative RT-PCR analysis. Gene expression was quantified by normalizing to GAPDH and assayed using Image Gauge. Results are representative of three independent experiments. (B) SP1 and SP3 protein levels in non-CF and CF epithelial cells were determined by Western blotting of nuclear extracts. Actin was used as an internal control. Results are representative of three independent experiments. (C) Sp1 binding in 16HBE14o- and CFBE41o- cells was assayed using labeled oligonucleotides containing the CpG#18-20 site and one putative Sp1 binding site (T2P(-64/-31)). Unlabeled WT oligonucleotides (lanes 3 and 8) or unlabeled mutant SP1 oligonucleotides (Table 1, T2P(-64/-31) SPm) (SP1 mt competitor, lanes 4 and 9) were added to the reaction solution for competition analysis. Supershift analysis was performed using an SP1 antibody (anti-SP1, lanes 5 and 10) to detect SP1-specific binding. Arrows indicate SP1-containing complexes (SP1) and supershifted SP1 (SS).

