
Figure 3.
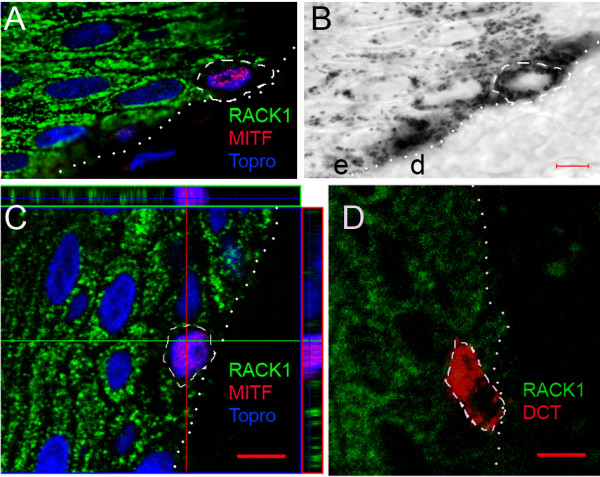
RACK1 expression in normal pig epidermis. (A, C, D) Confocal microscopy analysis of RACK1 protein (green fluorescence), and double labelling for either MITF (A, C) or DCT (D) (red fluorescence) on pig skin. Normal epidermis were from control Meishan minipig (A, B), and MeLiM (C, D). (B) Transmission photograph corresponding to (A). (C) Three dimensional 'orthogonal' slice projection analysis is included: the large central panel shows a single optical slice through which an x axis (green line) and a y axis (red line) were defined for sliced z-axis reconstruction. The corresponding results for the x, z slice (top) and the y, z slice (right) are shown. The blue line represents the position of the central panel image in the z stack. Nuclear counterstaining is shown in blue. Note the RACK1 cytosolic spotty signal on keratinocytes and its absence in the melanocyte indicated by the white dashed line. Dotted lines indicate epidermis-dermis boundaries. e, epidermis; d, dermis. Bar = 5 μm.