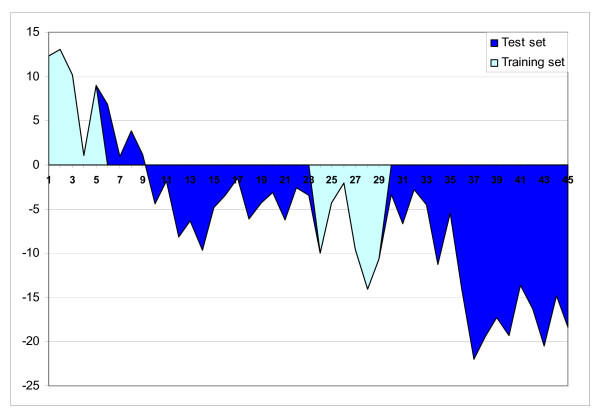
Figure 7.
Class prediction based on qPCR analyses of eight genes in liver. The training and test sets were analyzed in two independent experiments indicated with different colours. The predictor function was constructed by linear discriminant analysis of the training group and verified using the test group. Numbers of individuals: 1–9 – EM, 10–23 – IM, 24–35 – LM and 36–45 – control.

