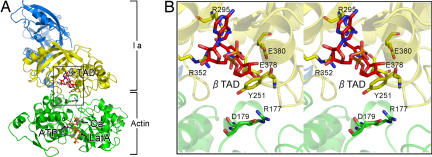
Fig. 1.
Whole structure of actin–Ia–β TAD complex. (A) Ribbon representation of actin–Ia–β TAD. Actin (green) and Ia (N domain, marine blue; C domain, yellow) molecules and cofactors [βTAD, ATP, latrunculin A (LatA), and calcium (Ca)] are labeled. (B) Detailed stereoview of the area around βTAD (boxed in A).

