Figure 1.

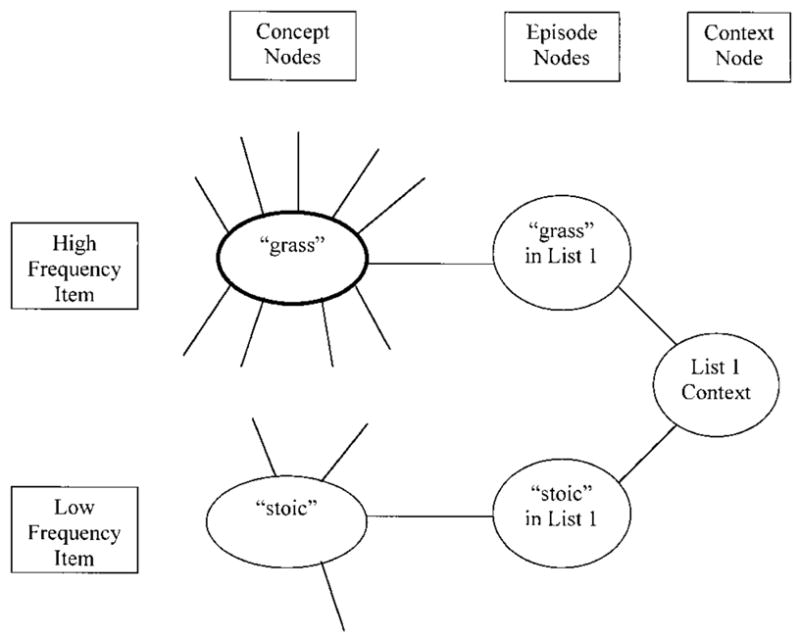
Schematic illustration of memory representations for high- and low-frequency items. The higher base level of activation for the high-frequency item is denoted with a thicker oval.

Schematic illustration of memory representations for high- and low-frequency items. The higher base level of activation for the high-frequency item is denoted with a thicker oval.