Figure 1:
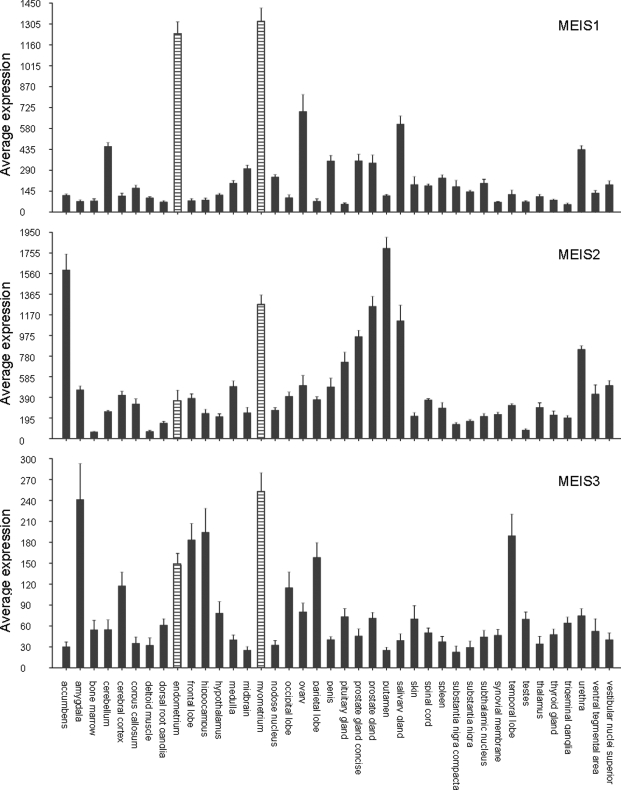
Expression of MEIS1-3 mRNAs in normal human tissue.
Visual representation of MEIS1, MEIS2 and MEIS3 expression in the ‘human body index’ Affymetrix data set in the public domain: 504 samples representing 87 different normal human tissues. For reasons of presentation, only tissues consisting of five or more different samples were shown: 40 tissues representing 329 samples. MEIS1 expression in endometrium and myometrium was higher than in any of the non-shown sets. Average MEIS expression in all 87 tissues was: MEIS1 338.3, MEIS2 516.6 and MEIS3 77.1. For comparison: average expression of glyceraldehyde-3-phosphate dehydrogenase (GAPDH) and β-actin in this data set was 9240 and 11 890, respectively. Average MEIS gene expression in endometrium (18 samples) was: MEIS1 1241 ± 83, MEIS2 358 ± 99 and MEIS3 149 ± 16. Average MEIS expression in myometrium (27 samples) was: MEIS1 1330 ± 90, MEIS2 1273 ± 84 and MEIS3 254 ± 26. The average expression over the different samples per tissue is shown. The error bars represent the SEM

