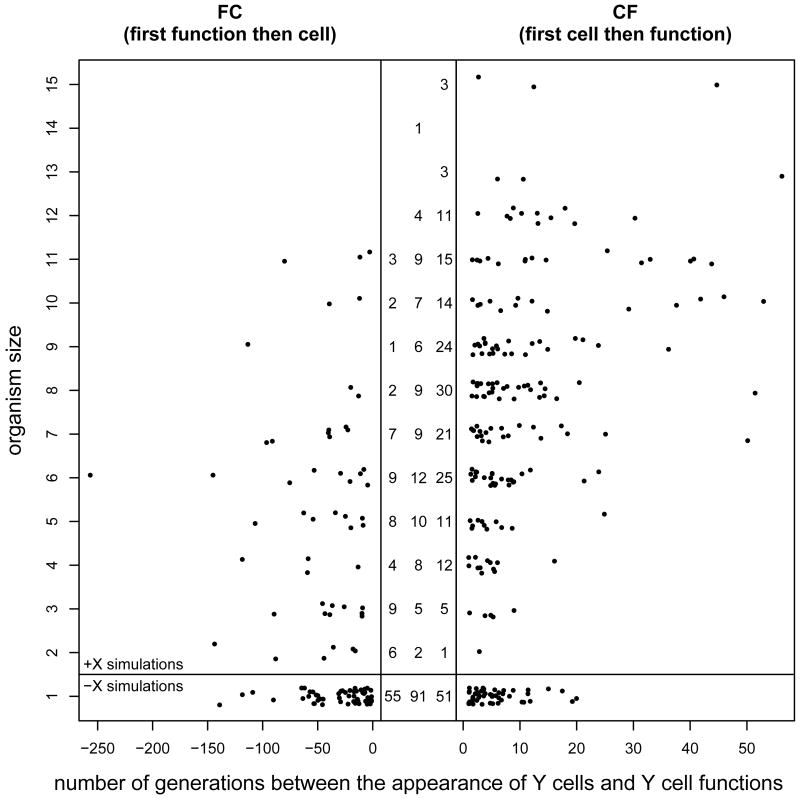
Figure 3.
Time, t, in number of generations between the appearance of specialized cells (Y cells) and the appearance of specialized functions. The data is grouped according to the size of the DISCO immediately before the appearance of Y cells. The plot contains data from the +X (organism size greater than one) and the -X (organism size equals one) simulations. The pannel in the middle shows the number of simulations that evolved Y cells via fc, si, and cf, respectively. The correlation between t and the size of the organism for evolutionary path cf is evident (Kendall's tau statistic: z = 5.15, p = 2.64 · 10−7). It shows how organism size affects the evolution of specialized cells by reducing the detrimental effect of temporarily unsuccessful evolutionary experiments with individual cells. To increase expressiveness I added small random noise to the organism size and used different plot regions for fc and cf.

