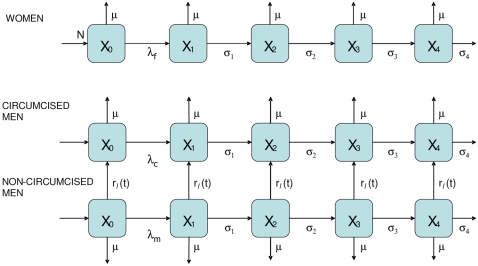
Figure 1. Flow diagram of model.
The model population is divided into females, circumcised males and non-circumcised males. In each group, X0 is the number of individuals not infected, X1 is the number with acute HIV infection, X2 is the number with latent infection, X3 is the number of people in a stage shortly prior to AIDS and X4 is the number with AIDS. The rate of progression between these stages of infection is given by σ1, σ2 and σ3 and the rate of death for those with AIDS is σ4; on average, individuals have acute infection for four months, latent infection for eight years, ‘pre-AIDS’ for twelve months and AIDS for six months. The rate of incidence among females, circumcised and non-circumcised men are represented by λf, λc and λm respectively. The intervention is simulated by moving non-circumcised men into the group of circumcised men, at a rate which can be different for men who are infected from those who are not or different in the different sexual activity groups (not shown): rs(t).

