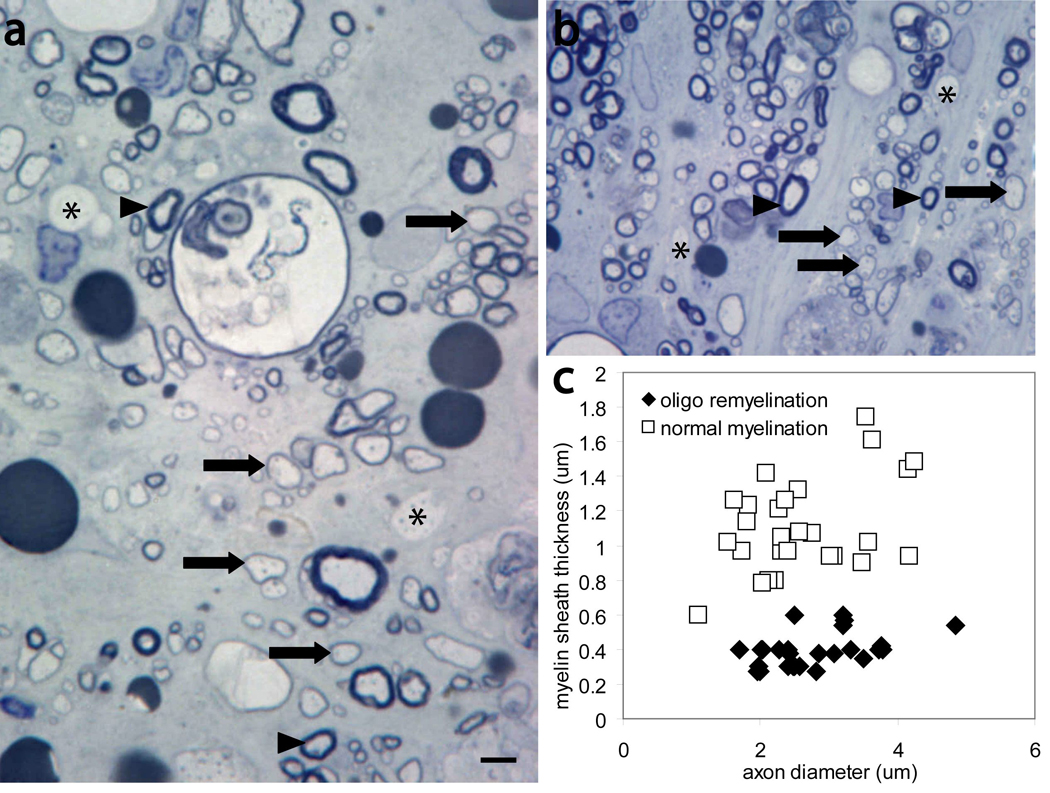
Figure 3. Oligodendrocyte remyelinated axons can be distinguished from normally-myelinated axons.

a, b, Toluidine blue-stained transverse sections of contused spinal cord at the magnification used for quantification and identification of normally-myelinated axons (arrowhead), oligodendrocyte remyelinated axons (arrows), demyelinated axons (asterisk). c, Myelin sheath thickness against axon diameter of normally-myelinated and oligodendrocyte remyelinated axons. The G ratio was 46 ± 3 (26)* for normally-myelinated axons and 15 ± 1 (26)* for oligodendrocyte remyelinated axons. *, Data are expressed as mean ± SEM; number in parentheses shows the number of axons scored. Scale bars= 5µm
