
Figure 6.
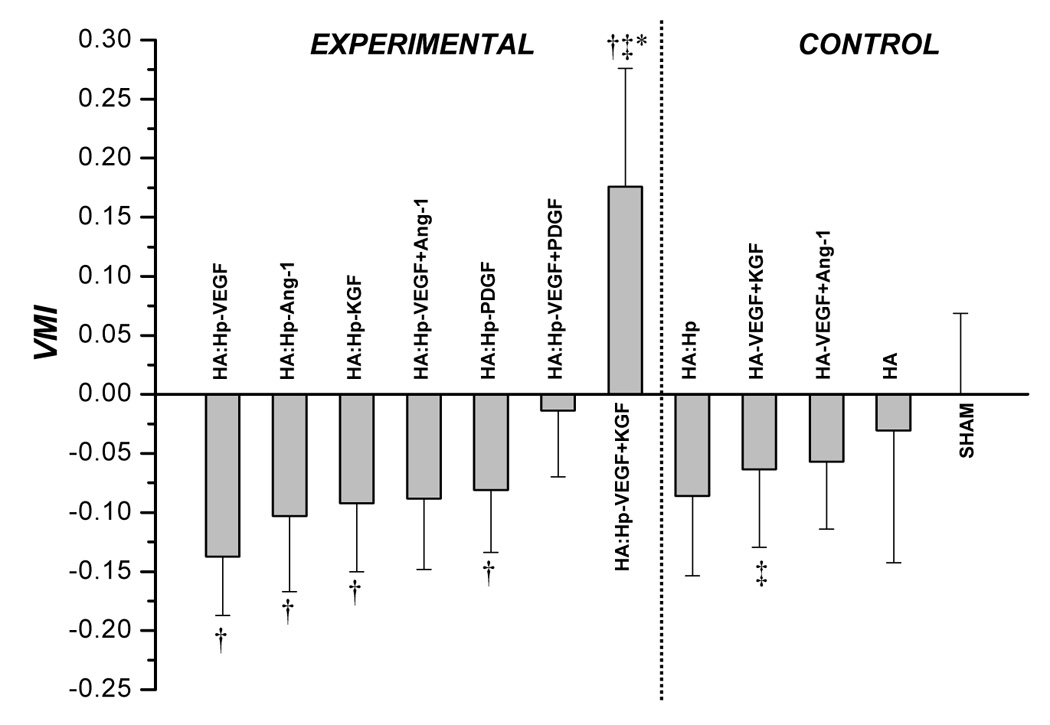
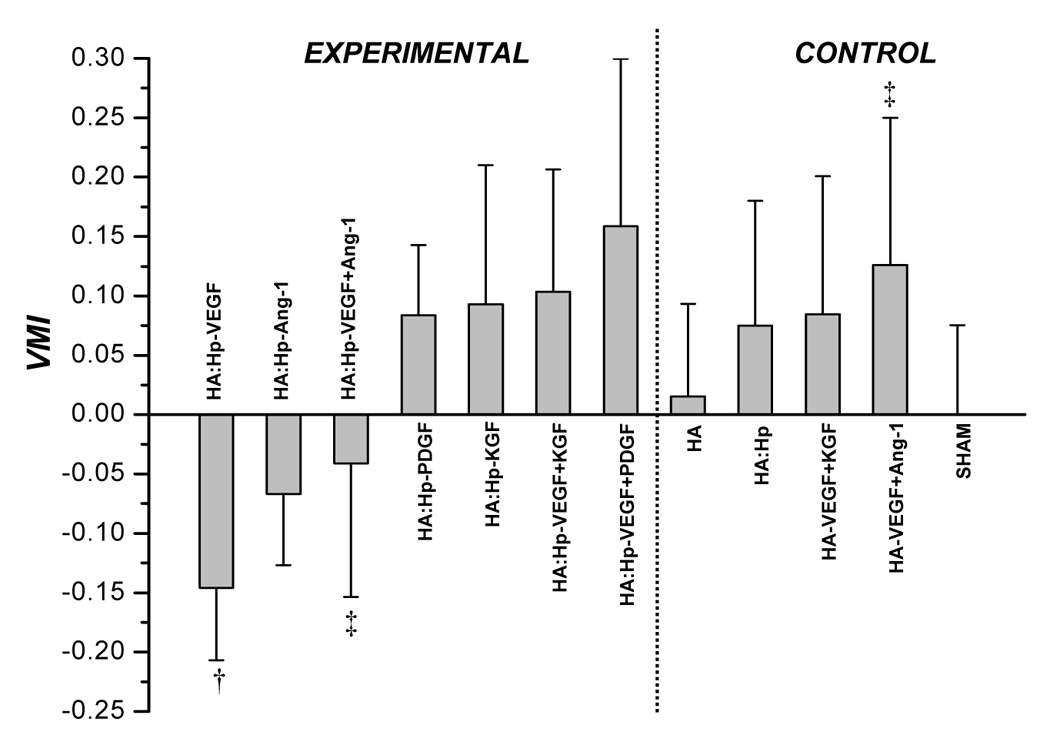
VMI values attained from tissue treated with control and cytokine loaded HA:Hp films at 7 days (a) and 14 days (b) post surgical implantation. VMI is defined in the text, Eq. (2). Mean ± s.d., n = 3; *p ≤ 0.05 vs. all other treatment cases; † p ≤ 0.05 vs. sham control; ‡ p ≤ 0.05 for pairwise comparison between experimental (HA:Hp) and control (HA) treatments utilizing the same cytokine combination.