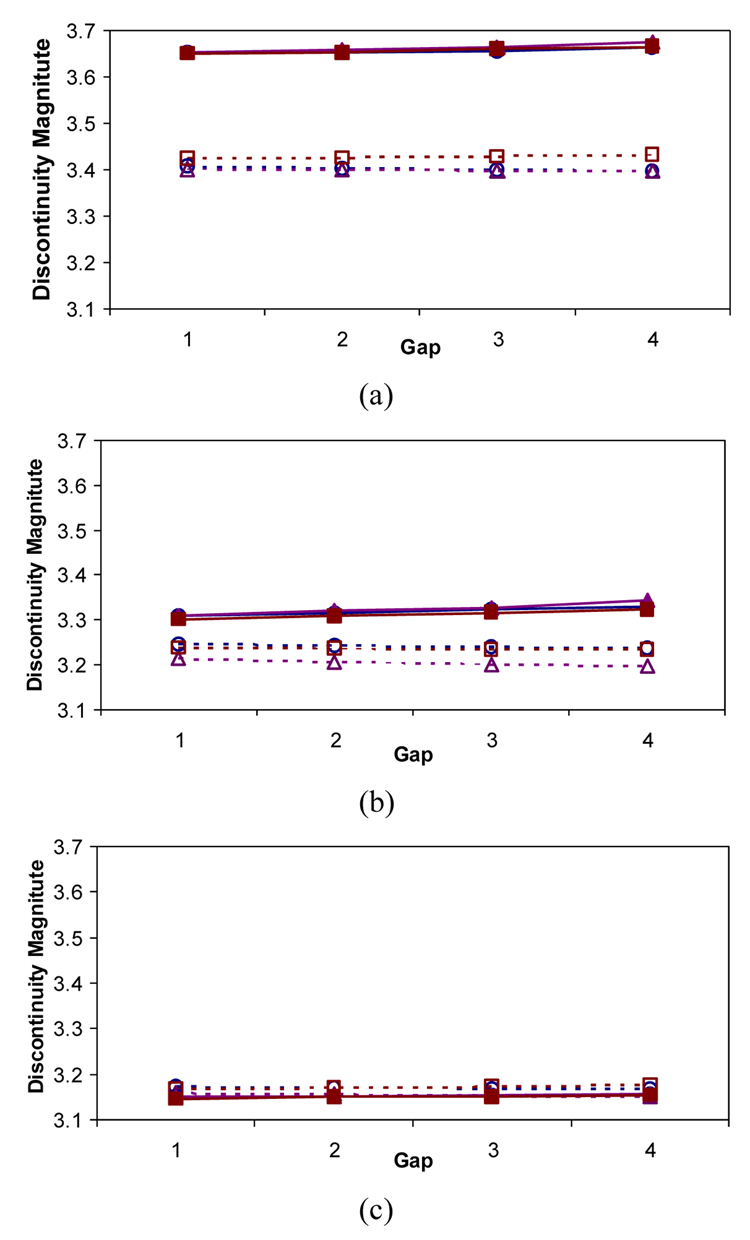
Figure 10.
Trajectory discontinuity (metric 1) as a function of physical gaps between adjacent sub-volumes: S1 and S2 in (a), S2 and S3 in (b), and S3 and S4 in (c). EX() and RM() refer to extrapolation method and residual minimization method respectively. The extrapolation method is plotted with dotted lines, while the residual minimization method is plotted with solid lines.


