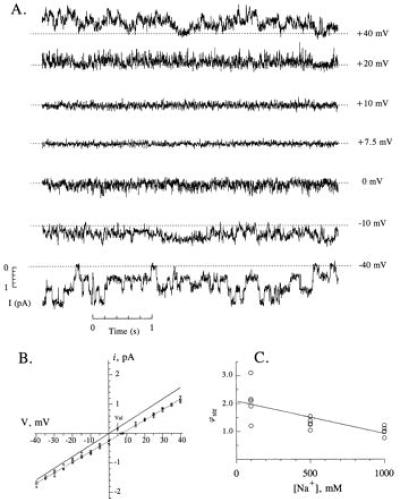
Figure 3.

Streaming potential measurements in αβγ-rENaC. (A) Continuous single channel record of αβγ-rENaC in a bilayer separating a 100 mM NaCl solution and a 100 mM NaCl plus 2 Osm/kg sucrose solution. The applied potential is shown to the right of each trace. (B) I–V relationships in 100 mM NaCl in the absence (solid lines, data points not shown) and presence of 2 Osm/kg sucrose on one side of the membrane (dashed line, open symbols represent data points for separate experiments). The reversal potential for the sucrose curve was 7.2 ± 1.1 mV (standard deviations). The reversal potential in the presence of 10 μM valinomycin (Val, arrow) was 5.2 ± 0.5 mV. (C) Streaming potentials measured at different NaCl concentrations. Each point represents a different membrane, but all were made in the presence of a 2 Osm/kg sucrose gradient. The line is a linear regression fit of the data with the slope of −1.16 ± 0.30 mV/M. The slope is statistically different from zero (P < 0.01, single-tailed Student’s t test).
