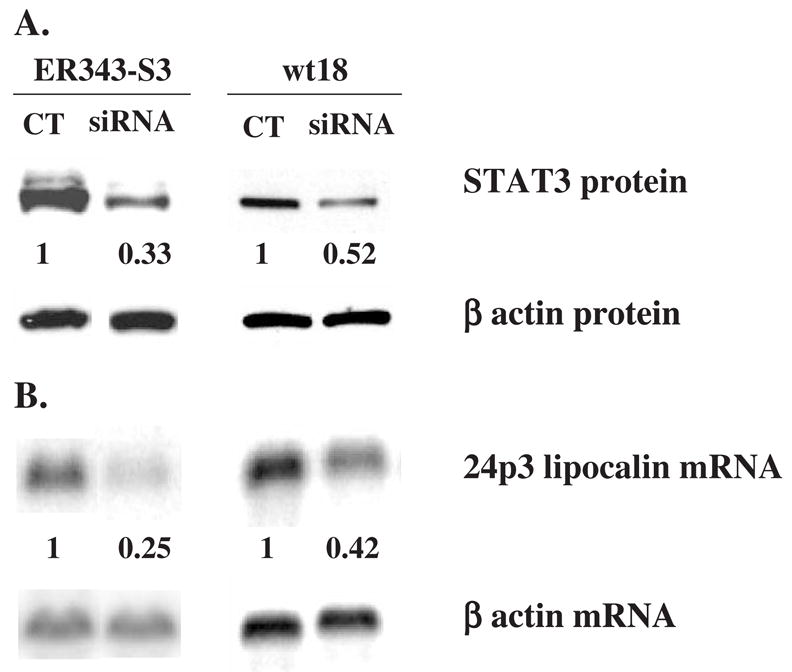
Figure 7.

Expression levels of STAT3 protein and 24p3 lipocalin mRNA in EPO-stimulated ER343-S3 and 32Dwt18 cells after transfection with siRNA. Cells were transfected with siRNA by electroporation, cultured in medium containing IL-3 for 5 hours, then washed and transferred to medium containing 2 units/mL of EPO and cultured for an additional 19 hours. Western blot analysis (A) and Northern blot analysis (B) were carried out as described in Figure 3 and Figure 1, respectively. Quantitation of STAT3 protein and 24p3 lipocalin mRNA was performed by PhosphorImager using the ImageQuant software program (Molecular Dynamics) and the average values of the siRNA/control (CT) ratios from at least two separate experiments are shown below the corresponding STAT3 and 24p3 lipocalin images. Cell line designations as in Figure 1 (wt18) and Figure 4 (ER343-S3).
