Abstract
Granulocyte colony-stimulating factor (G-CSF) plays an essential role in regulating multiple aspects of hematopoiesis. To elucidate the role of G-CSF in controlling hematopoietic cell migration capabilities, we studied inducible expression of the myeloid-specific marker, integrin αMβ2 (CD11b/CD18, Mac-1), in the myeloid cell line, 32D. We found that G-CSF stimulates the synthesis and cell surface expression of αM and β2 integrin sub-units. Induction of both αM and β2 is dependent on Stat3, a major G-CSF-responsive signaling protein. However, the kinetics of expression suggested the involvement of an intermediate protein regulated by Stat3. Our results demonstrate that Stat3 signaling stimulates the expression of PU.1, a critical regulator of myelopoiesis. Furthermore, we show that PU.1 is an essential intermediate for the inducible expression of αMβ2 integrin. Thus, Stat3 promotes αMβ2 integrin expression through its activation of PU.1. These findings indicate that G-CSF-dependent Stat3 signals stimulate the changes in cell adhesion and migration capabilities that occur during myeloid cell development. These data also demonstrate a link between Stat3 and PU.1, suggesting that Stat3 may play an instructive role in hematopoiesis.
Granulocyte colony-stimulating factor (G-CSF)1 is a potent regulator of neutrophil development and function in vivo (1–3). Clinically, G-CSF is used to treat neutropenia due to bone marrow suppression and to mobilize hematopoietic progenitor cells to the peripheral circulation, facilitating their collection for bone marrow transplants (4, 5). Mice deficient in the G-CSF receptor (G-CSFR) gene (G-CSFR-null) or mice expressing a chimeric G-CSFR/erythropoietin receptor (GE) are severely neutropenic, with ~12% of the normal level of circulating neutrophils. However, these animals display significant levels of bone marrow granulopoiesis (50–70% of the normal level) (2, 3). Knock-in studies with truncated G-CSFR isoforms suggest a function for Stat3, a major G-CSF-responsive signaling molecule, in the formation of circulating neutrophils (6, 7). Thus, G-CSFR signals through Stat3 may be essential for differentiation events that render neutrophils competent to exit the bone marrow and enter the peripheral circulation.
Bone marrow neutrophils from G-CSFR-null animals appear morphologically mature, although they are not fully functional, demonstrating defective chemotaxis in response to inflammatory mediators, reduced adhesion through β2 integrins, and impaired migration in vivo (8). GE/GE neutrophils also exhibit chemotaxis defects (3). G-CSF-induced mobilization of hematopoietic progenitor cells, which appears to require degranulation of bone marrow neutrophils and concomitant protease secretion (9, 10), is impaired in GE/GE mice (3). These results support the conclusion that G-CSFR-specific signals are essential for complete neutrophil differentiation as well as the idea that neutrophil development is associated with alterations in cell adhesion and migration capabilities.
In addition to G-CSF, several transcription factors play key functions in granulopoiesis, including members of the C/EBP family (e.g. C/EBPα and C/EBPε) and the Ets-related protein PU.1 (11). Deletion of PU.1 in mice abrogates myeloid and B cell development (12, 13). In myeloid cells, this block is due in part to the fact that PU.1 controls cytokine responsiveness by regulating expression of cytokine receptors, such as macrophage colony-stimulating factor receptor (14). However, enforced expression of the macrophage colony-stimulating factor receptor in primary PU.1-null progenitors restores M-CSF-dependent proliferation but not macrophage development. In the granulocytic lineage, transient stimulation with multilineage cytokines can overcome the block in G-CSF-responsiveness in PU.1-null progenitors, although further neutrophil development is attenuated. Studies in the PU.1-null cell line, 503, have demonstrated that PU.1 is required for the expression of specific myeloid marker proteins such as neutrophil collagenase and gelatinase, whereas cytokines appear to provide a permissive signal for cell survival and growth (15). Collectively, these results indicate that PU.1 regulates genes that control terminal myeloid cell development, in addition to its regulation of cytokine-responsiveness (14, 15). PU.1 is also required for cell surface expression of several integrin subunits (e.g. α4, α5, αM) and PU.1-null cells demonstrate impaired homing and migration in vivo (16).
Since G-CSFR-dependent neutrophil development is associated with changes in cell adhesion and migration capabilities, we set out to determine whether G-CSFR-specific signals regulate expression of the myeloid-specific integrin αMβ2. Our results show that G-CSF stimulates increased synthesis and cell surface expression of αM and β2 integrin subunits. Studies with a chimeric erythropoietin receptor, engineered to specifically activate Stat3 in place of Stat5, or use of a dominant inhibitory Stat3 isoform demonstrated a requirement for Stat3 in αMβ2 induction. However, the kinetics of αM and β2 expression suggested that an intermediate signal is involved. We found that G-CSF stimulates the expression of PU.1 by a Stat3-dependent mechanism. Moreover, we show that inducible expression of αMβ2 requires functional PU.1, demonstrating that PU.1 is a critical intermediate in cytokine-responsive αMβ2 synthesis. Collectively our results suggest that Stat3 signaling provides an instructive function by stimulating PU.1, thereby promoting myeloid cell development and the concomitant induction of proteins that regulate cell adhesion and trafficking functions.
EXPERIMENTAL PROCEDURES
Description of cDNAs and Generation of Retrovirus
A retroviral vector encoding a dominant inhibitory Stat3 isoform (pBABE-Stat3-DN) was generously provided by Dr. Curt Horvath. Stat3-DN contains alanine substitutions at critical residues in the DNA binding domain and a carboxyl-terminal FLAG epitope (17). Retroviral supernatants were generated by transient transfection of the BOCS 23 packaging cell line, using the calcium phosphate transfection method described previously (18). The murine PU.l cDNA was subcloned into the mammalian expression vector pMEX. To construct PU.1-TAD, the internal NsiI/NcoI restriction fragment within the PU.1 cDNA was removed, 3′- and 5′-overhanging sequences were filled in, and the plasmid was religated. Transient transfection assays in COS cells and DNA sequence analysis were used to confirm that the PU.1 open reading frame was conserved 3′ of the deletion. This cloning strategy removes residues 33–100, which encode the entire PU.1 transactivation domain (i.e. acidic and glutamine-rich regions) (19).
Cell Culture Conditions and Generation of Cell Lines
32D cells expressing murine G-CSFR (32D.G-CSFR) or ER-S3 (32D.ER-S3), a chimeric murine EpoR engineered to activate Stat3 in place of Stat5, were described previously (20). Cell lines were maintained in RPMI containing 10% fetal calf serum and 5% WEHI-conditioned media (RPMI/FCS/WEHI); the latter was used as a source of IL-3. To generate cell lines encoding Stat3-DN, 32D.G-CSFR and 32D.ER-S3 cells were infected with retroviral supernatants containing pBABE-Stat3-DN for 4 h at 37 °C in the presence of 4 μg/ml polybrene. Cells were cultured for 48 h in RPMI/FCS/WEHI and then selected in media containing 1 μg/ml puromycin. Clonal cell lines were derived by limiting dilution, and Stat3-DN expression was verified by FLAG immunoblot assays. To generate cell lines expressing PU.1-TAD, ER-S3 cells were electroporated with linearized plasmids encoding PU.1-TAD (pMex/PU.1-TAD) and the puromycin resistance gene (pBABEpuro). Cell lines were selected in puromycin and cloned as described above. Expression of PU.1-TAD was confirmed by PU.1 immunoblot assays (not shown).
Cytokine Treatments, Metabolic Protein Labeling, Cell Surface Iodinations, and Morphologic Analyses
Cells were treated with 25 ng/ml G-CSF or 0.5 units/ml Epo, as indicated throughout. Proteins were metabolically labeled with 0.5 mCi/ml [35S]methionine and cysteine (1175 Ci/mmol; PerkinElmer Life Sciences) for 30 min at 37 °C, followed by incubation in complete media for 90 min at 37 °C. To label cell surface proteins, cells were radioiodinated as described previously (20). To examine cell morphology, cells were prepared on glass slides using the cytospin method followed by Wright-Giemsa staining.
Antibodies, Immunoprecipitations, and Immunoblot Analyses
Polypeptides were immunoprecipitated from cell extracts prepared in the presence of Triton X-100, as previously described (20), using commercial antibodies for and integrin subunits (e.g. M1/70 αM and β2 M18/2, respectively; PharMingen). Whole cell lysates were analyzed by immunoblot assays with PU.1 antiserum (Santa Cruz Biotechnology, Inc., Santa Cruz, CA), as previously described (20).
Ribonuclease Protection Assays and Electrophoretic Gel Mobility Shift Assays (EMSAs)
Total RNA was prepared from exponentially growing cultures using TriReagent (Molecular Research Center, Inc.). RNase protection probes corresponding to the entire murine PU.1 coding region, nucleotides 4 –263 of the murine SOCS3 coding region, or nucleotides 9 –105 of the murine GAPDH coding region were synthesized in the presence of [32P]UTP (800 mCi/mmol; Amersham Biosciences) using the Maxiscript kit (Ambion), following the manufacturer’s instructions, and purified. Ribonuclease protection assays were performed with the RPA III kit (Ambion), as described by the manufacturer. The results were analyzed by electrophoresis on 5% acrylamide gels containing 8 M urea followed by autoradiography. EMSAs were performed as described previously (20), using an oligonucleotide probe that corresponds to nucleotides 1–30 of the murine PU.1 promoter (5′-GGCCCTTCGATAAAATCAGGAACTTGTGCTGG-3′), which contains the PU.1 DNA binding element (21).
RESULTS
Signaling through G-CSFR and ER-S3 Stimulates αMβ2 Integrin Expression
The IL-3-dependent cell line 32D provides an in vitro model for granulocytic development (22, 23). When maintained in IL-3, 32D cells proliferate indefinitely and lack detectable expression of the myeloid marker protein Mac-1 (i.e. αMβ2 integrin; CD11b/CD18). Signaling through the G-CSFR stimulates cell surface expression of the αM integrin subunit, as judged by antibody stain and flow cytometry (data not shown), and leads to cell cycle arrest and terminal granulocytic differentiation (22, 23). Thus, IL-3 appears to maintain 32D cells in an undifferentiated state, which may represent an early myeloid progenitor, whereas G-CSF promotes granulocytic development.
To study the regulatory mechanisms involved in G-CSF-induced differentiation and define how these mechanisms control cell adhesion and migration capabilities, we examined the expression of β2 integrins, which regulate the trafficking of mature myeloid cells (see Ref. 24 and references within). 32D cells stably expressing the murine G-CSFR (32D.G-CSFR) were used for these experiments. Parallel studies were done in 32D cells expressing wild type EpoR (32D.WT EpoR) or ER-S3 (32D.ER-S3), an EpoR engineered to activate Stat3 in place of Stat5 (20), to evaluate potential Stat3 functions. 32D.G-CSFR cells were cultured in medium containing WEHI culture supernatant as an IL-3 source or in medium containing G-CSF, and β2 integrin subunit expression was examined by metabolic pulse-labeling experiments. 32D.WT EpoR and 32D.ER-S3 cells were cultured in IL-3- or Epo-containing medium and analyzed correspondingly. All cell lines expressed low levels of β2 when cultured in IL-3-containing medium (Fig. 1A, lanes 1 and 5; data not shown). β2 synthesis was stimulated dramatically by signaling through the G-CSFR or ER-S3 (Fig. 1A, lanes 2 and 6). In contrast, signaling through the WT EpoR did not stimulate β2 expression, relative to IL-3-treated cells (data not shown).
Fig. 1. Expression of αM and β2 integrin subunits is induced by G-CSFR and ER-S3 signaling.
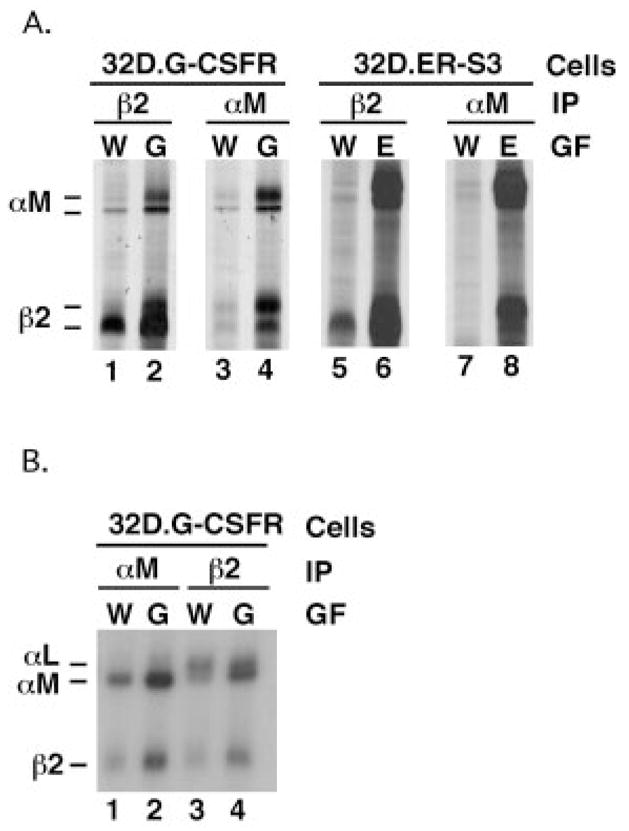
A, 32D.G-CSFR cells were cultured in RPMI/FCS containing WEHI cell conditioned medium (W) as a source of IL-3 or RPMI/FCS containing 25 ng/ml G-CSF (G) for 7 days. 32D.ER-S3 cells were cultured in WEHI-containing (W) or Epo-containing (E) medium (0.5 units/ml Epo) for 2 days. Proteins were metabolically labeled with [35S]methionine and cysteine and immunoprecipitated with antibodies specific for murine αM or β2 integrin subunits, as indicated. Polypeptides were resolved by SDS-PAGE and visualized by autoradiography. B, 32D.G-CSFR cells were cultured in WEHI- or G-CSF-containing medium as described for A. Cells were radioiodinated, polypeptides were immunoprecipitated from detergent cell extracts with antibodies specific for murine αM or β2 integrin subunits (as indicated), and polypeptides were resolved by SDS-PAGE. The migration positions of αM (~170 kDa) and β2 (~95 kDa) integrin subunits are shown.
Under nondenaturing immunoprecipitation conditions, α and β integrin subunits remain associated. Thus, examination of the β2 immunoprecipitations revealed the presence of co-precipitating polypeptides with apparent molecular weights corresponding to those for the αM and αL integrin subunits (170 and 180 kDa, respectively) (Fig. 1A, lanes 1, 2, 5, and 6). Low levels of αM were synthesized in cells cultured in IL-3-containing medium, whereas αM synthesis was dramatically induced by signaling through the G-CSFR or ER-S3 (Fig. 1A, lanes 3, 4, 7, and 8). Signaling through the WT EpoR did not induce expression of αM integrin subunit over the levels detected in IL-3-treated cells (data not shown). Expression of αL was detected in each cell line when cultured in IL-3 and was not induced significantly by activation of G-CSFR, ER-S3, or WT EpoR (data not shown). However, the β2 subunit appears to interact preferentially with newly synthesized αM, as judged by analysis of β2 co-immunoprecipitations from metabolically labeled cells (Fig. 1A and data not shown).
To investigate whether the induction of β2 and αM synthesis led to their increased expression at the cell surface, IL-3- or G-CSF-treated 32D.G-CSFR cells were radioiodinated, and polypeptides were immunoprecipitated with antibodies specific for β2 and αM. Cell surface β2 expression was detected in cells maintained in IL-3-containing medium and was stimulated slightly by G-CSF treatment (Fig. 1B, lanes 3 and 4), whereas αM cell surface levels were increased dramatically in response to G-CSF (Fig. 1B, lanes 1 and 2). αL is the major β2-associated subunit on the surface of cells cultured in IL-3-containing medium, as judged by β2 coimmunoprecipitations. In G-CSF-treated cells, however, αM is also a major β2-associated subunit (Fig. 1B, lanes 3 and 4). Similar results, which demonstrated induced cell surface expression of αM and β2, were obtained in Epo-treated 32D.ER-S3 cells, whereas Epo-treated WT EpoR cells did not show elevated surface levels of αM and β2 (data not shown). Therefore, signaling through G-CSFR or ER-S3 stimulates cell surface expression of the αMβ2 integrin by enhancing nascent synthesis and cell surface presentation of the β2 and αM subunits.
Functional Stat3 Is Required for Cytokine-inducible αMβ2 Expression
Stat3 is a major G-CSFR-responsive signaling molecule (25) and is strongly activated by ER-S3 (20), suggesting that it might function in αMβ2 induction. To test this, we established 32D.G-CSFR and 32D.ER-S3 cell lines that express a dominant inhibitory Stat3 isoform (Stat3-DN). Stat3-DN is functionally inactive due to the presence of alanine substitutions at critical residues in the DNA binding domain and contains a carboxyl-terminal FLAG epitope tag to facilitate detection (17). FLAG immunoblotting experiments demonstrated the presence of Stat3-DN in each cell line (data not shown). Stat3-DN function was tested by analysis of G-CSF-responsive SOCS3 expression, a known Stat3 target gene (26). SOCS3 was rapidly induced in G-CSF-treated 32D.G-CSFR cells, whereas its expression was largely abrogated in G-CSF-treated 32D.G-CSFR cells containing Stat3-DN (32D.G-CSFR + Stat3-DN) (Fig. 2). Thus, Stat3-DN blocks G-CSF-dependent Stat3 signaling, as expected. Similarly, Stat3-DN abrogated Epo-inducible Stat3 activation in ER-S3 cells (data not shown).
Fig. 2. G-CSF-responsive Stat3 signaling is abrogated in the presence of Stat3-DN.
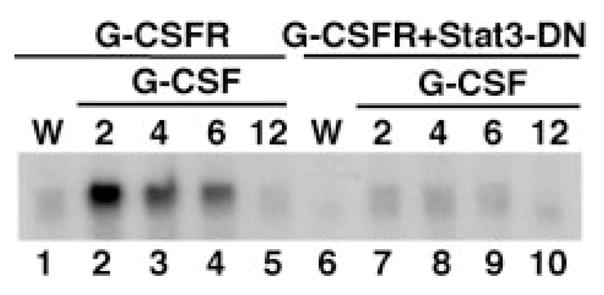
32D.G-CSFR and 32D.G-CSFR + Stat3-DN cells were maintained in WEHI-containing medium (W) or were washed extensively and then stimulated with medium containing 25 ng/ml G-CSF (G) for 2, 4, 6, or 12 h, as indicated. Total RNA was isolated and subjected to ribonuclease protection assays with probes specific for murine SOCS3 and GAPDH. SOCS3 mRNA protections are shown. GAPDH mRNA levels were equivalent in all samples (not shown).
Metabolic pulse labeling experiments were used to determine whether Stat3-DN attenuated inducible integrin expression. 32D.G-CSFR + Stat3-DN cells showed decreased levels of β2 and αM synthesis in response to G-CSF, relative to 32D.G-CSFR cells (Fig. 3A). Similarly, ER-S3 cells containing Stat3-DN demonstrated abrogated induction of β2 and αM synthesis in response to Epo (Fig. 3B). Cytokine-inducible cell surface expression of β2 and αM was also blocked by expression of Stat3-DN in G-CSFR or ER-S3 cells (Fig. 3C, compare lanes 2 and 4, and lanes 6 and 8; data not shown). Thus, a functional Stat3 signal is required for cytokine-responsive induction of αM and β2 synthesis as well as expression of αMβ2 integrin at the cell surface.
Fig. 3. G-CSF-responsive induction of αM and β2 integrin subunit expression is blocked by Stat3-DN.

A, 32D.G-CSFR (G-CSFR) and 32D.G-CSFR + Stat3-DN (G-CSFR + Stat3-DN) cells were cultured in RPMI/FCS containing WEHI cell conditioned medium (W) or 25 ng/ml G-CSF (G) for 7 days. Proteins were metabolically labeled with [35S]methionine and cysteine and immunoprecipitated with antibodies specific for murine αM or β2 integrin subunits, as indicated. Polypeptides were resolved by SDS-PAGE and visualized by autoradiography. B, 32D.ER-S3 (ER-S3) and 32D.ER-S3 + Stat3-DN (ER-S3 + Stat3-DN) cells were cultured in RPMI/FCS containing WEHI cell conditioned medium (W) or 0.5 units/ml Epo (E) for 2 days. Proteins were metabolically labeled and analyzed by immunoprecipitations as described for A. C, 32D.G-CSFR cells, containing or lacking Stat3-DN (as indicated), were cultured in WEHI-containing (W) or G-CSF-containing (G) medium as described for A. Cells were radioiodinated, polypeptides were immunoprecipitated from detergent cell extracts with antibodies specific for murine αM or β2 integrin subunits (as indicated), and polypeptides were resolved by SDS-PAGE. The migration positions of αM (~170 kDa) and β2 (~95 kDa) integrin subunits are shown.
PU.1 Is Induced by Activated G-CSFR and ER-S3
Time course studies revealed that β2 and αM synthesis was induced between 3 and 7 days of G-CSF treatment in 32D.G-CSFR cells (data not shown). A corresponding increase was detected in β2 and αM mRNA levels, suggesting that transcription of the β2 and αM genes was stimulated in response to G-CSF (data not shown). Since Stat3 is activated within minutes of G-CSF stimulation (data not shown), these results indicated that an intermediate, Stat3-dependent signaling protein might regulate the β2 and αM genes. We postulated that PU.1 was involved, based on the fact that PU.1 DNA binding sites are present in the β2 and αM promoters (27, 28).
Immunoblot analyses showed that low levels of PU.1 were detected in 32D.G-CSFR, 32D.WT EpoR, and 32D.ER-S3 cells when cultured in IL-3-containing medium. PU.1 levels were increased significantly in response to G-CSF in 32D.G-CSFR cells and in response to Epo in 32D.ER-S3 cells, yet they were unaffected by signaling through the WT EpoR (Fig. 4, top panels). PU.1 mRNA levels were induced correspondingly in 32D.G-CSFR and 32D.ER-S3 cells, as determined by RNase protection assays (Fig. 4, B and C, lower and middle panels, respectively). This induction of PU.1 was accompanied by an increase in PU.1 DNA binding activity, as judged by EMSAs with a PU.1-specific oligonucleotide (Fig. 4C and data not shown). Therefore, signaling through G-CSFR or ER-S3 stimulates PU.1 expression and activation, whereas WT EpoR signaling does not affect PU.1, suggesting a requirement for Stat3 in inducible regulation of PU.1.
Fig. 4. G-CSF induces the expression and activation of PU.1.
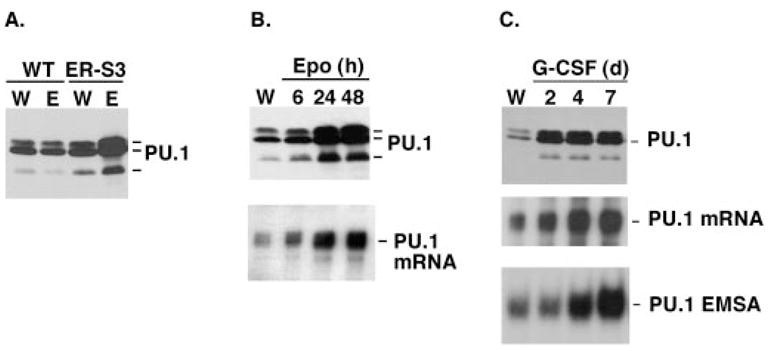
A, 32D.WT EpoR (WT) and 32D.ER-S3 (ER-S3) cells were cultured in RPMI/FCS containing WEHI cell conditioned medium (W) or 0.5 units/ml Epo (E) for 2 days. Whole cell lysates were analyzed by PU.1 immunoblots. The migration position of PU.1 (~42 kDa) is indicated. B, 32D.ER-S3 cells were cultured in RPMI/FCS containing 0.5 units/ml Epo for 6, 24, or 48 h or were cultured in RPMI/FCS containing WEHI cell conditioned medium (W), as indicated. Whole cell lysates were analyzed by PU.1 immunoblots (upper panel), and total RNA was analyzed by RNase protection assays with probes specific for murine PU.1 and GAPDH. PU.1 mRNA protections are shown in the lower panel. GAPDH mRNA levels were equivalent in all samples (not shown). C, 32D.G-CSFR cells were cultured in RPMI/FCS containing WEHI cell conditioned medium (W) or 25 ng/ml G-CSF (G) for 2, 4, or 7 days, as indicated. Whole cell lysates were analyzed by PU.1 immunoblots (upper panel), and total RNA was analyzed by RNase protection assays as described for B. PU.1 mRNA protections are shown (middle panel). GAPDH mRNA levels were equivalent in all samples (not shown). Nuclear extracts were analyzed by EMSAs with a PU.1-specific probe (lower panel). The location of the PU.1-oligonucleotide complex is indicated.
Cytokine-stimulated Expression of PU.1 Requires Stat3
To test whether inducible expression of PU.1 was dependent on functional Stat3, PU.1 levels were examined in IL-3- or G-CSF-treated 32D.G-CSFR and 32D.G-CSFR + Stat3-DN cells. These experiments demonstrated that G-CSF-inducible PU.1 expression was blocked in 32D.G-CSFR + Stat3-DN cells relative to 32D.G-CSFR cells (Fig. 5). Similarly, Epo-inducible PU.1 expression was abrogated in ER-S3 cells expressing Stat3-DN (data not shown). Thus, cytokine-inducible expression of PU.1 requires a functional Stat3 signal.
Fig. 5. G-CSFR induces PU.1 expression by a Stat3-dependent mechanism.
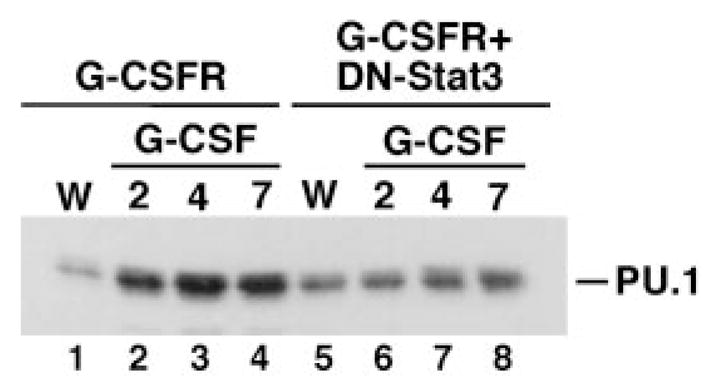
32D.G-CSFR and 32D.G-CSFR + Stat3-DN cells were cultured in RPMI/FCS containing WEHI cell conditioned medium (W) or 25 ng/ml G-CSF (G) for 2, 4, or 7 days, as indicated. Whole cell extracts were used in immunoblot assays with PU.1-specific antibody. The migration position of PU.1 (~42 kDa) is indicated.
Induction of αMβ2 and PU.1 in Response to Cytokines Is Dependent on the PU.1 Transactivation Domain
To determine whether PU.1 is an intermediate in cytokine-inducible expression of αMβ2 integrin, we generated a dominant inhibitory isoform of PU.1 (PU.1-TAD) by deletion of the entire PU.1 transactivation domain (e.g. residues 33–100 were deleted, which encode the acidic and glutamine-rich transactivation domains (19)). PU.1-TAD was stably expressed in 32D.ER-S3 cells, and integrin expression was evaluated by metabolic labeling and immunoprecipitation experiments. Inducible expression of αM and β2 is dramatically abrogated in ER-S3 cells expressing PU.1-TAD (Fig. 6). These results demonstrate that a functional PU.1 protein is required for cytokine-stimulated expression of αMβ2 integrin.
Fig. 6. Cytokine-inducible integrin expression is abrogated by PU.1-TAD.
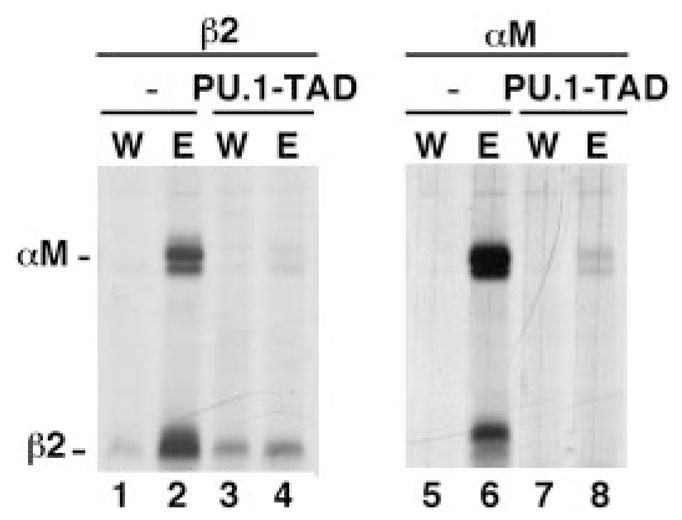
32D.ER-S3 cells that lack (−) or contain PU.1-TAD (PU.1-TAD) were cultured in medium containing IL-3 (W) or Epo (E) for 2 days, as indicated. Proteins were metabolically labeled and immuno-precipitated with antibodies specific for murine β2 or αM integrin sub-units. Polypeptides were resolved by SDS-PAGE and visualized by autoradiography. The migration positions of β2 and αM are indicated.
A PU.1 DNA binding site is present in the murine PU.1 promoter and PU.1 has been shown to positively regulate its expression (21). To determine whether PU.1-TAD affected the basal or cytokine-inducible expression of PU.1, steady state levels of PU.1 were evaluated by immunoblot analysis. PU.1 levels were similar in IL-3-treated ER-S3 cells lacking or containing PU.1-TAD, suggesting that basal PU.1 expression is not dependent on PU.1 transactivation function (Fig. 7, lanes 1 and 3). In contrast, PU.1-TAD abrogated inducible expression of PU.1 in ER-S3 cells (Fig. 7, compare lanes 2 and 4). This indicates that the PU.1 transactivation domain is required for cytokine-stimulated expression of PU.1.
Fig. 7. PU.1-TAD blocks cytokine-induced PU.1 expression.
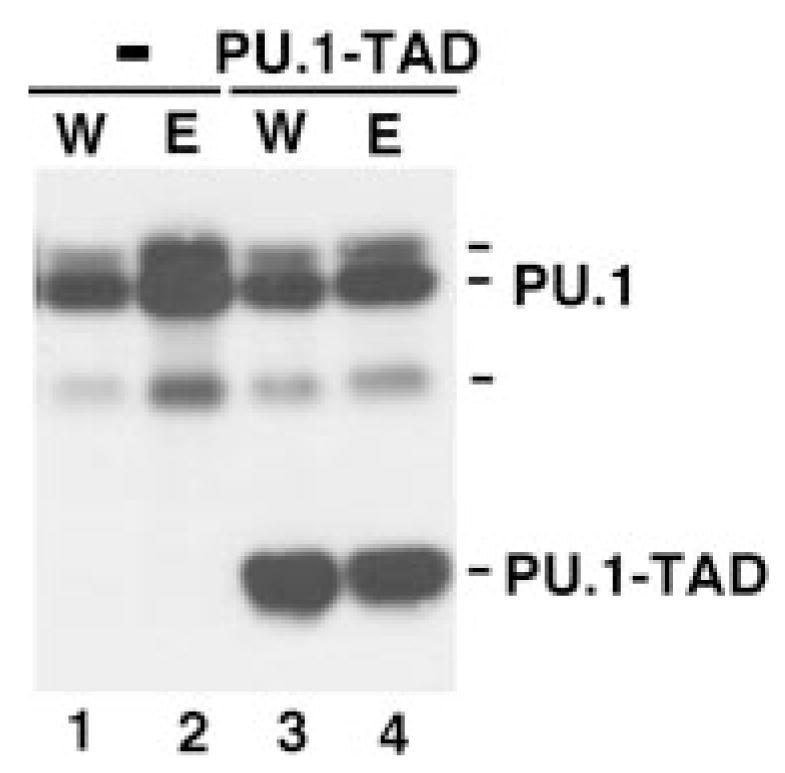
32D.ER-S3 cells that lack (−) or contain PU.1-TAD (PU.1-TAD) were cultured in medium containing IL-3 (W) or Epo (E) for 2 days, as indicated. Whole cell extracts were resolved by SDS-PAGE and used in immunoblot assays with PU.1-specific antibody. The migration positions of PU.1 (~42 kDa) and PU.1-TAD (~30 kDa) are indicated.
Functional Stat3 and PU.1 Are Required for ER-S3-dependent Changes in Cell Morphology
Granulocytic progenitor cells undergo distinct changes in morphology during their differentiation into neutrophils. Previous studies have shown that G-CSFR signaling promotes these morphological changes in 32D cells by a Stat3-dependent process (29). To determine whether signaling through ER-S3 stimulated similar changes in cell morphology, cells were analyzed by cytospins and Wright-Giemsa staining. As expected, ER-S3 cells maintained in IL-3-containing medium were morphologically immature, as evidenced by their blastlike appearance with a high nuclear/cytoplasmic ratio and basophilic cytoplasmic staining. In contrast, ER-S3 cells cultured in Epo underwent morphological alterations observed during granulocytic maturation. These included a decreased nuclear/cytoplasmic ratio, decreased basophilic cytoplasmic staining, and increased amounts of cytoplasmic vesicular-like components (Fig. 8, compare A and B). Expression of dominant inhibitory isoforms of Stat3 or PU.1 abrogated these morphological changes to different degrees, consistent with their inhibitory activity on cytokine-inducible αMβ2 expression (Figs. 3 and 6). Epo-treated ER-S3 cells containing PU.1-TAD demonstrated an immature blastlike morphology (Fig. 8D), while ER-S3 cells containing Stat3-DN showed an intermediate morphology (Fig. 8C). Thus, these results demonstrate that ER-S3 signaling stimulates granulocytic maturation in 32D cells by a Stat3- and PU.1-dependent process.
Fig. 8. Epo promotes granulocytic maturation of 32D.ER-S3 cells by a Stat3- and PU.1-dependent mechanism.
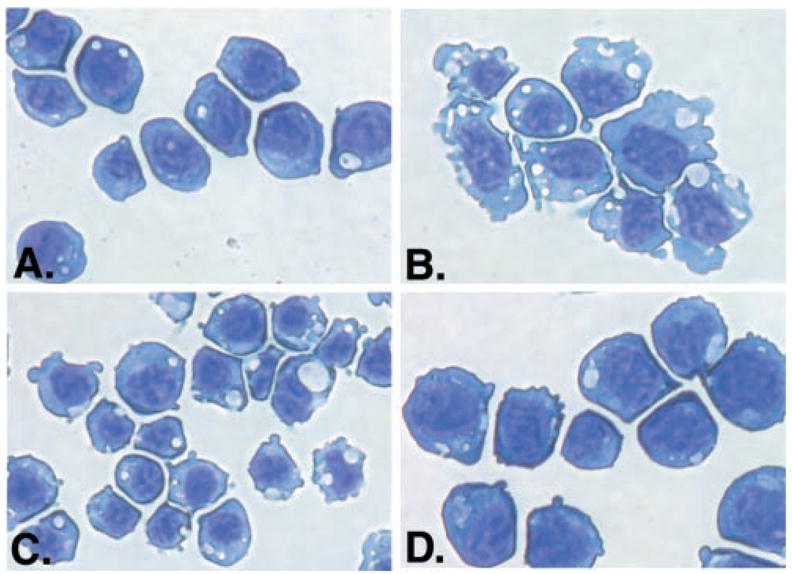
A and B, 32D.ER-S3 cells were cultured in medium containing IL-3 (A) or Epo (B) for 2 days. C and D, 32D.ER-S3 cells expressing Stat3-DN (C) or PU.1-TAD (D) were cultured in medium containing Epo for 2 days. Cytospins were performed, and cells were stained with Wright-Giemsa.
Collectively, our results indicate that cytokine-responsive Stat3 signaling stimulates PU.1 expression. This results in enhanced PU.1 activity, leading to the induction of αMβ2 integrin expression and the induction of granulocytic development.
DISCUSSION
Our studies make several novel contributions to understanding the function of cytokines in hematopoietic cells. Through the use of both loss-of-function and gain-of-function experimental approaches, we have demonstrated that a cytokine-responsive Stat protein plays a critical role in regulating the expression of a transcription factor that controls hematopoietic lineage specification. Our observation that Stat3 signaling promotes PU.1 expression and activation suggests that Stat3 may play an instructive role in hematopoiesis. Second, we have shown that Stat3 signaling leads to induction of the myeloid marker protein, αMβ2 integrin, demonstrating that cytokine-responsive signaling pathways can regulate the changes in cell adhesion and migration capabilities that are associated with myeloid cell development.
Regulation of myeloid marker protein expression in response to G-CSF has been shown to involve both Stat3-dependent and Stat3-independent pathways. For example, induction of myeloperoxidase and C/EBPε is mediated by Stat3-independent signals emanating from the G-CSFR (30, 29). In contrast, G-CSFR-dependent cell cycle arrest and induction of p27Kip1 is dependent on functional Stat3 (31). The work described herein demonstrates that a Stat3-dependent pathway stimulates PU.1 expression, leading to induction of expression of the myeloid-specific integrin αMβ2 (i.e. Mac-1). Previously, we have shown that a Stat3-dependent pathway controls induction of β2 integrin function in 32D cells (20). Thus, collectively, these studies indicate that Stat3 regulates cell cycle progression and alterations in cell migratory capabilities during myeloid development.
It is interesting to note that G-CSF-induced expression of critical myeloid cell transcription factors can be controlled by Stat3-dependent or Stat3-independent (e.g. PU.1 and C/EBPε, respectively) pathways. Furthermore, enforced expression of PU.1, C/EBPα, or C/EBPε in myeloid cell lines can promote differentiation, as judged by morphological alterations and analysis of specific marker proteins (15, 29, 32). Therefore, redundant signaling pathways from the G-CSFR may promote myeloid development, similar to the observations of functional redundancy among EpoR-responsive signaling pathways controlling erythropoiesis (33, 34).
Studies of mice with targeted mutations at the G-CSFR locus have indicated that G-CSFR-specific signals are essential for the production of fully mature, circulating neutrophils (3, 7). For example, signaling through the EpoR intracellular region fails to support the production of normal levels of circulating neutrophils in GE/GE mice, although near normal levels of granulocytes are found in the bone marrow (3). A similar phenotype is found in G-CSFR d715F mice, which have impaired activation of Stat3 in response to G-CSF (7). One interpretation of these data is that Stat3 is specifically required for G-CSF to activate the expression of proteins that control neutrophil migration from the bone marrow. However, bone marrow neutrophils from G-CSFR-null mice also exhibit several defects in mature cell functions, including impaired adhesion through β2 integrins, lack of chemotaxis in response to inflammatory mediators, and failure to migrate in vivo (8). Therefore, the data indicate that G-CSFR-specific signals are required for complete neutrophil development, including changes in cell adhesion and migration capabilities. Our observation that G-CSFR-dependent Stat3 signals are required for induction of αMβ2 expression (this study) and β2 integrin function (20) provides support for this concept. Future studies will test this by evaluating the adhesion and migration abilities of myeloid cells isolated from mice with targeted mutations in the G-CSFR.
In agreement with previous studies (7, 30), our results suggest an important function for Stat3 in granulocytic development. This was shown in two ways, through the use of Stat3-DN, which blocked G-CSFR-induced maturation, and by ER-S3, which promoted granulocytic differentiation. Differentiation of ER-S3 cells was judged by the analysis of myeloid marker protein expression (e.g. αMβ2) and by changes in cell morphology observed during granulopoiesis. Epo-treated ER-S3 cells demonstrate a morphology that is similar to granulocytes at the myelocyte/metamyelocyte stage, whereas ER-S3 cells maintained in IL-3-containing medium appear as immature myeloblasts. Therefore, ER-S3 signaling promotes granulocytic development through a Stat3-dependent mechanism.
However, the precise role of Stat3 in hematopoiesis in vivo remains unclear. Deletion of the Stat3 gene leads to early embryonic lethality (35); thus, its role in hematopoiesis could not be evaluated. Conditional deletion of Stat3 has been achieved in neutrophils and macrophages through use of the Cre/Lox system (36). In this model, the LysMcre/Stat3flox/− mice, cre recombinase expression is driven from the murine lysozyme M locus. Mature neutrophils and macrophages are found in LysMcre/Stat3flox/− mice, leading to the assumption that Stat3 function may be dispensable for myelopoiesis. Stat3-null leukocytes demonstrate impaired responses to IL-10, with overproduction of inflammatory mediators, and LysMcre/Stat3flox/− mice develop chronic enterocolitis, indicating that Stat3 target genes are critical for inflammatory cell deactivation (36).
However, it is equally possible that the Stat3 gene deletion occurs in the LysMcre/Stat3flox/− mice at a late stage of myeloid development, and progress through earlier developmental stages may require Stat3. Recently, a mouse model was developed in which enhanced green fluorescent protein expression was driven from the lysozyme M locus (37). As expected, mature neutrophils and monocytes exhibited high enhanced green fluorescent protein expression. However, the majority of immature myeloid cells in the bone marrow showed only weak enhanced green fluorescent protein expression. In addition, enhanced green fluorescent protein-positive cells expressed αMβ2, demonstrating that induction of αMβ2 is concomitant with or precedes expression from the lysozyme M locus during myelopoiesis (37). These data indicate that expression from the lysozyme M locus occurs primarily in mature neutrophils and monocytes and not in cells at earlier stages of development. This supports the idea that cre expression in LysMcre/Stat3flox/− mice occurs at late stages of myelopoiesis. Therefore, targeted deletion of Stat3 in an early hematopoietic progenitor cell is required to fully evaluate the functional role of Stat3 in myeloid cell development.
Our studies provide new insight into the regulatory pathways that control PU.1, demonstrating that cytokine signals through Stat3 stimulate PU.1 expression and activation. The precise mechanisms involved in PU.1 regulation are not yet understood. PU.1 mRNA levels are induced by G-CSFR or ER-S3 signaling, suggesting that PU.1 is regulated transcriptionally by cytokines. In fact, the proximal portion of the murine PU.1 promoter (~400 bp) contains two weak consensus Stat binding sites (e.g. TTN5AA) (21), and current studies are directed at testing their function in cytokine-inducible PU.1 expression. However, a recent study has demonstrated that distal elements also play an important role in PU.1 regulation, and myeloid-specific expression can be conferred by a 3.5-kb genomic fragment located ~14 kb upstream of the transcriptional start site (38). In addition, PU.1 has been shown to regulate its own expression in myeloid cells through a PU.1 consensus binding site in the proximal promoter (21), and our work suggests that cytokines might activate a PU.1 autoregulatory loop, as evidenced by the requirement for the PU.1 transactivation domain in cytokine-stimulated induction. Furthermore, conditionally active C/EBPα stimulates induction of PU.1 in myeloid cells (32). Therefore, myeloid-specific PU.1 regulation is complex and is mediated through distinct DNA elements and transacting factors. Stat3 may be involved by activating the PU.1 promoter through an upstream element, or Stat3 may stimulate a transactivating factor that directly controls PU.1 gene transcription. Further analysis of cytokine-inducible PU.1 gene regulation is required to distinguish between these possibilities. Nonetheless, our results provide an explanation for the observation that PU.1 levels are induced during cytokine-stimulated myeloid development (39) and indicate a critical role for Stat3.
Recent work has shown that normal hematopoiesis is dependent on the tight and appropriate regulation of PU.1. For example, myelopoiesis requires high PU.1 expression, which may involve the activation of a PU.1 autoregulatory loop, while B cell development requires only low levels of PU.1 (21, 40). In addition, PU.1 can antagonize erythroid development by blocking the activity of GATA-1 (41). Therefore, in light of previous findings, our work suggests that cytokine-activated expression of PU.1 may be required to induce a threshold level of PU.1 necessary to promote complete granulocytic development and the concomitant alterations in cell adhesion and migration capabilities.
Acknowledgments
We thank Xiaoling Xie for observations that suggested the studies described herein, Curt Horvath for providing Stat3-DN, and Brad McIntyre for advice and use of many reagents. We thank Amgen Corp. for generous gifts of recombinant Epo and G-CSF. In addition, we thank members of the Watowich and McIntyre laboratories for advice throughout the course of this work and Brad McIntyre, Peter Murray, and Greg Longmore for critical review of the manuscript.
Footnotes
This work was supported by National Institutes of Health Grant CA 77447 and grants from the Gillson Longenbaugh Foundation and the University of Texas M.D. Anderson Cancer Center Institutional Grants Program (to S. S. W.).
The abbreviations used are: G-CSF, granulocyte colony-stimulating factor; G-CSFR, G-CSF receptor; GE, G-CSFR/erythropoietin receptor; IL-3, interleukin-3; WT, wild type; C/EBP, CCAAT/enhancer-binding protein; FCS, fetal calf serum.
References
- 1.Lieschke GJ, Grail D, Hodgson G, Metcalf D, Stanley E, Cheers C, Fowler KJ, Basu S, Zhan YF, Dunn AR. Blood. 1994;84:1737–1746. [PubMed] [Google Scholar]
- 2.Liu F, Wu HY, Wesselschmidt R, Kornaga T, Link DC. Immunity. 1996;5:491–501. doi: 10.1016/s1074-7613(00)80504-x. [DOI] [PubMed] [Google Scholar]
- 3.Semerad CL, Poursine-Laurent J, Liu F, Link DC. Immunity. 1999;11:153–161. doi: 10.1016/s1074-7613(00)80090-4. [DOI] [PubMed] [Google Scholar]
- 4.Duhrsen U, Villeval J-L, Boyd J, Kannourakis G, Morstyn G, Metcalf D. Blood. 1988;72:2074–2081. [PubMed] [Google Scholar]
- 5.Welte K, Gabrilove J, Bronchud MH, Platzer E, Morstyn G. Blood. 1996;88:1907–1929. [PubMed] [Google Scholar]
- 6.McLemore ML, Poursine-Laurent J, Link DC. J Clin Invest. 1998;102:483–492. doi: 10.1172/JCI3216. [DOI] [PMC free article] [PubMed] [Google Scholar]
- 7.McLemore ML, Grewal S, Liu F, Archambault A, Poursine-Laurent J, Haug J, Link DC. Immunity. 2001;14:193–204. doi: 10.1016/s1074-7613(01)00101-7. [DOI] [PubMed] [Google Scholar]
- 8.Betsuyaku T, Liu F, Senior RM, Haug JS, Brown EJ, Jones SL, Matsushima K, Link DC. J Clin Invest. 1999;103:825–832. doi: 10.1172/JCI5191. [DOI] [PMC free article] [PubMed] [Google Scholar]
- 9.Levesque J-P, Takamatsu Y, Nilsson SK, Haylock DN, Simmons PJ. Blood. 2001;98:1289–1297. doi: 10.1182/blood.v98.5.1289. [DOI] [PubMed] [Google Scholar]
- 10.Liu F, Poursine-Laurent J, Link DC. Blood. 2000;95:3025–3031. [PubMed] [Google Scholar]
- 11.Tenen DG, Hromas R, Licht JD, Zhang DE. Blood. 1997;90:489–519. [PubMed] [Google Scholar]
- 12.McKercher SR, Torbett BE, Anderson KL, Henkel GW, Vestal DJ, Baribault H, Klemsz M, Feeney AJ, Wu GE, Paige CJ, Maki RA. EMBO J. 1996;15:5647–5658. [PMC free article] [PubMed] [Google Scholar]
- 13.Scott EW, Simon MC, Anastasi J, Singh H. Science. 1994;265:1573–1577. doi: 10.1126/science.8079170. [DOI] [PubMed] [Google Scholar]
- 14.DeKoter RP, Walsh JC, Singh H. EMBO J. 1998;17:4456–4468. doi: 10.1093/emboj/17.15.4456. [DOI] [PMC free article] [PubMed] [Google Scholar]
- 15.Anderson KL, Smith KA, Perkin H, Hermanson G, Anderson C-G, Jolly DJ, Maki RA, Torbett BE. Blood. 1999;94:2310–2318. [PubMed] [Google Scholar]
- 16.Fisher RC, Lovelock JD, Scott EW. Blood. 1999;94:1283–1290. [PubMed] [Google Scholar]
- 17.Horvath CM, Wen Z, Darnell JJE. Genes Dev. 1995;9:984–994. doi: 10.1101/gad.9.8.984. [DOI] [PubMed] [Google Scholar]
- 18.Pear WS, Nolan GP, Scott ML, Baltimore D. Proc Natl Acad Sci U S A. 1993;90:8392–8396. doi: 10.1073/pnas.90.18.8392. [DOI] [PMC free article] [PubMed] [Google Scholar]
- 19.Klemsz MJ, Maki RA. Mol Cell Biol. 1996;16:390–397. doi: 10.1128/mcb.16.1.390. [DOI] [PMC free article] [PubMed] [Google Scholar]
- 20.Wooten DK, Xie X, Bartos D, Busche RA, Longmore GD, Watowich SS. J Biol Chem. 2000;275:26566–26575. doi: 10.1074/jbc.M003495200. [DOI] [PMC free article] [PubMed] [Google Scholar]
- 21.Chen H, Ray-Gallet D, Zhang P, Hetherington CJ, Gonzalez DA, Zhang DE, Moreau-Gachelin F, Tenen DG. Oncogene. 1995;11:1549–1560. [PubMed] [Google Scholar]
- 22.de Koning JP, Soede-Bobok AA, Schelen AM, Smith L, van Leeuwen D, Santini V, Burgering BMT, Bos JL, Lowenberg B, Touw IP. Blood. 1998;91:1924–1933. [PubMed] [Google Scholar]
- 23.Kato J-Y, Sherr CJ. Proc Natl Acad Sci U S A. 1993;90:11513–11517. doi: 10.1073/pnas.90.24.11513. [DOI] [PMC free article] [PubMed] [Google Scholar]
- 24.Etzioni A, Doerschuk CM, Harlan JM. Blood. 1999;94:3281–3288. [PubMed] [Google Scholar]
- 25.Nicholson SE, Starr R, Novak U, Hilton DJ, Layton JE. J Biol Chem. 1996;271:26947–26953. doi: 10.1074/jbc.271.43.26947. [DOI] [PubMed] [Google Scholar]
- 26.Auernhammer CJ, Bousquet C, Melmed S. Proc Natl Acad Sci U S A. 1999;96:6964–6969. doi: 10.1073/pnas.96.12.6964. [DOI] [PMC free article] [PubMed] [Google Scholar]
- 27.Pahl HL, Scheibe RJ, Zhang DE, Chen HM, Galson DL, Maki RA, Tenen DG. J Biol Chem. 1993;268:5014–5020. [PubMed] [Google Scholar]
- 28.Rosmarin AG, Caprio D, Levy R, Simkevich C. Proc Natl Acad Sci U S A. 1995;92:801–805. doi: 10.1073/pnas.92.3.801. [DOI] [PMC free article] [PubMed] [Google Scholar]
- 29.Nakajima H, Ihle JN. Blood. 2001;98:897–905. doi: 10.1182/blood.v98.4.897. [DOI] [PubMed] [Google Scholar]
- 30.Shimozaki K, Nakajima K, Hirano T, Nagata S. J Biol Chem. 1997;272:25184–25189. doi: 10.1074/jbc.272.40.25184. [DOI] [PubMed] [Google Scholar]
- 31.de Koning JP, Soede-Bobok AA, Ward AC, Schelen AM, Antonissen C, van Leeuwen D, Lowenberg B, Touw IP. Oncogene. 2000;19:3290–3298. doi: 10.1038/sj.onc.1203627. [DOI] [PubMed] [Google Scholar]
- 32.Wang X, Scott E, Sawyers CL, Friedman AD. Blood. 1999;94:560–571. [PubMed] [Google Scholar]
- 33.Goldsmith MA, Mikami A, You Y, Liu KD, Thomas L, Pharr P, Longmore GD. Proc Natl Acad Sci U S A. 1998;95:7006–7011. doi: 10.1073/pnas.95.12.7006. [DOI] [PMC free article] [PubMed] [Google Scholar]
- 34.Longmore GD, You Y, Molden J, Liu KD, Mikami A, Lai SY, Pharr P, Goldsmith MA. Blood. 1998;91:870–878. [PubMed] [Google Scholar]
- 35.Takeda K, Noguchi K, Shi W, Tanaka T, Matsumoto M, Yoshida N, Kishimoto T, Akira S. Proc Natl Acad Sci U S A. 1997;94:3801–3804. doi: 10.1073/pnas.94.8.3801. [DOI] [PMC free article] [PubMed] [Google Scholar]
- 36.Takeda K, Clausen BE, Kaisho T, Tsujimura T, Terada N, Forster I, Akira S. Immunity. 1999;10:39–49. doi: 10.1016/s1074-7613(00)80005-9. [DOI] [PubMed] [Google Scholar]
- 37.Faust N, Varas F, Kelly LM, Graf T. Blood. 2000;96:719–726. [PubMed] [Google Scholar]
- 38.Li Y, Okuno Y, Zhang P, Radomska HS, Chen H, Iwasaki H, Akashi K, Klemsz MJ, McKercher SR, Maki RA, Tenen DG. Blood. 2001;98:2958–2965. doi: 10.1182/blood.v98.10.2958. [DOI] [PubMed] [Google Scholar]
- 39.Cheng T, Shen H, Giokas D, Gere J, Tenen DG, Scadden DT. Proc Natl Acad Sci U S A. 1996;93:13158–13163. doi: 10.1073/pnas.93.23.13158. [DOI] [PMC free article] [PubMed] [Google Scholar]
- 40.DeKoter RP, Singh H. Science. 2000;288:1439–1441. doi: 10.1126/science.288.5470.1439. [DOI] [PubMed] [Google Scholar]
- 41.Rekhtman N, Radparvar F, Evans T, Skoultchi AI. Genes Dev. 1999;13:1398–1411. doi: 10.1101/gad.13.11.1398. [DOI] [PMC free article] [PubMed] [Google Scholar]


