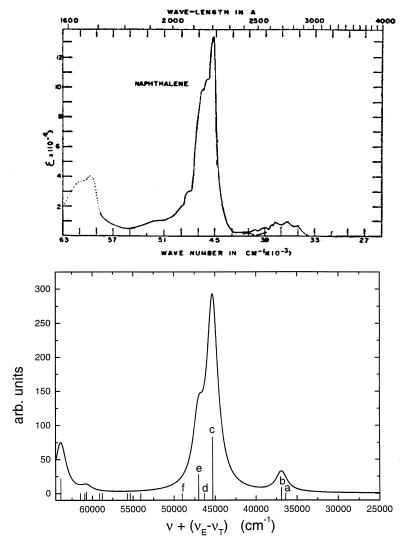
Figure 2.
Absorption spectra of naphthalene. (Upper) Experiment (11). (Lower) Computed absorption profile (blue shifted by Δν = 5,000 cm−1 to match the frequency of the strongest peak. The vertical lines represent the corresponding oscillator strength. The electronic modes of levels marked with a, b, c, d, e, and f are shown in Fig. 5.

