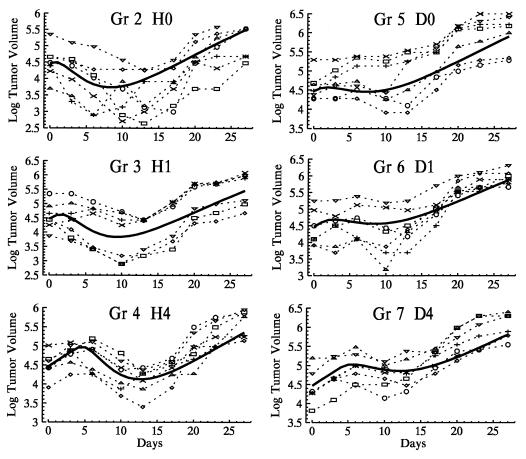
Figure 1.
Tumor volumes for groups receiving the single agents doxorubicin or rhuMAb HER-2 at the times indicated in Table 1 (groups 2–7). Symbols connected by dashed lines are the observed natural log tumor volumes for each mouse. The solid line is the expected trajectory for the group predicted by the growth/drug effect model using the population mean parameter vector.

