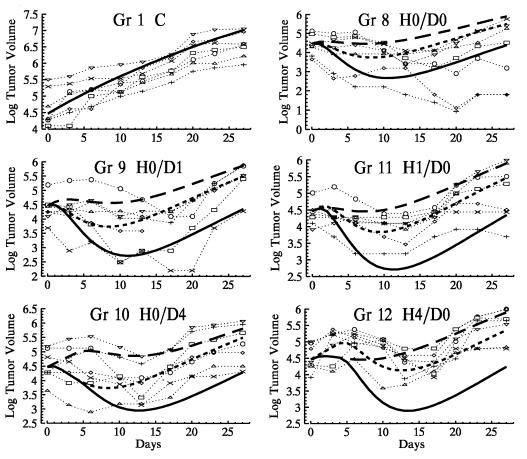
Figure 3.
The symbols connected by dotted lines are the observed trajectories for mice receiving combination therapy (groups 8–12). The solid line is the expected tumor volume trajectory for combination therapy under the null hypothesis of additivity. The upper long-dashed line is the expected effect had doxorubicin been given alone; the short-dashed line is the expected effect had rhuMAb HER-2 been given alone. Observed trajectories and the expected trajectory for the control group (group 1) are shown for reference.

