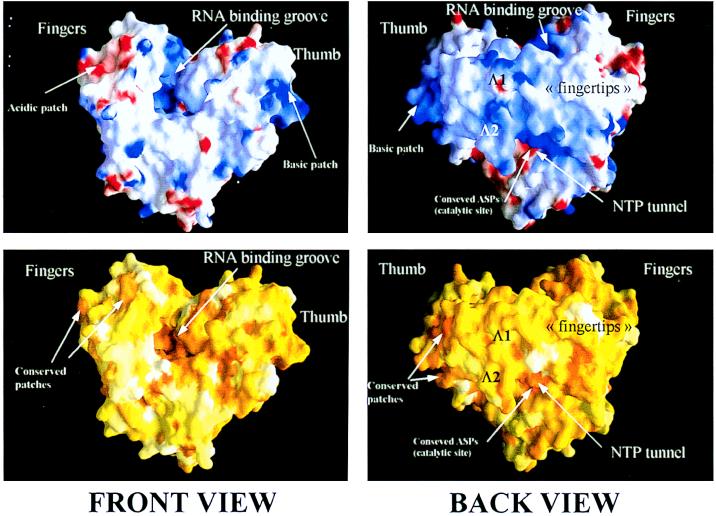
Figure 3.
The molecular surface of the HCV RdRp, front view (Left) and back view (Right). (Upper) Electrostatic potential calculated on the molecular surface. Positive and negative charges are indicated in blue and red, respectively. The positively charged groove along which RNA would bind during viral replication is apparent in the front view. The region of the thumb at the very C terminus of the catalytic domain of NS5B is also positively charged. In the back view, the lower ridge of the “bridge” formed by loops Λ1 and Λ2 is seen to have a strong positive charge. This area corresponds to the “tunnel” where NTP would access to the polymerizing complex. The red patch underneath the tunnel corresponds to the strictly conserved aspartic acids that are known to coordinate the catalytic Mg2+ ions. (Lower) The molecular surface is colored according to sequence conservation from an alignment that included one representative from each of the know HCV serotypes (1 through 6) and all three of the related GB viruses (A, B, and C) (32). The scoring ranges from 0 (white, no conservation) to 1 (dark orange, strict conservation). Note that both the RNA binding groove and the putative NTP tunnel are highly conserved. Note also the conserved ridges lining the acidic patch mentioned above and the conservation of the basic region at the back of the thumb.

