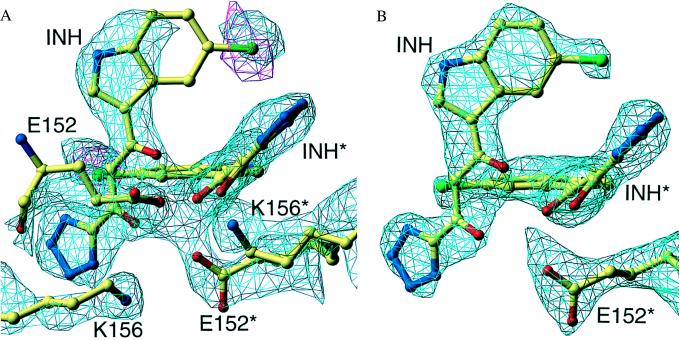
Figure 2.
Electron density in the active site region of subunit A. (A) The cyan contours show the difference map between the experimental data sets of the inhibitor-soaked and the unsoaked crystals at the 2-σ level. The red contours represent the anomalous density for the chlorine atom at the 2-σ level. The final model is superimposed on this density. Note the high density for the side chains of E152 and K156, attributed to the big decrease in the B values for these residues in the soaked crystals. (B) The same active site region of subunit A, with density from a 2Fo-Fc map of the inhibitor-soaked crystal, contoured at the 1-σ level.

