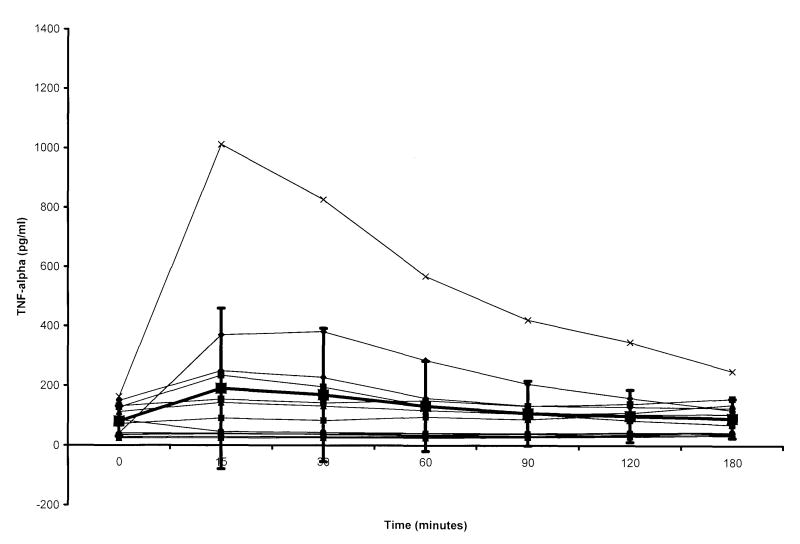
Figure 2.
Tumour necrosis factor (TNF)-α concentrations in plasma of female swine achieving return of spontaneous circulation (ROSC), versus time. Time 0 = pre-arrest, i.e. control value; time intervals after 0 represent time from ROSC. Large boxes with error bars represent mean and standard deviation for the group. In females, only the value at 15 min was greater than pre-arrest concentrations.

