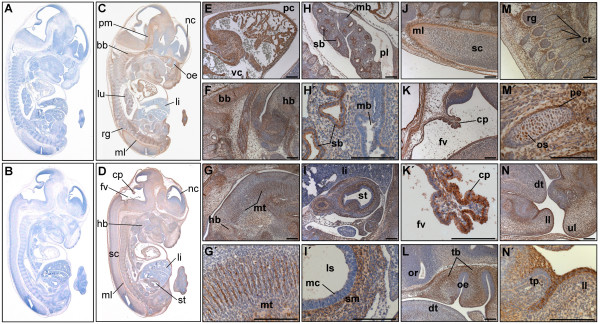
Figure 5.
PKD3 expression at embryonic stage E13.5. Immunohistochemistry was performed on sagittal sections (6 μm) of E13.5 mouse embryos. (A) – (B) Control sections incubated without primary antibody. (C) – (N') Sections incubated with anti-PKD3 antibody (1:2000). bb: cartilage primordium of basioccipital bone (clivus), cp:choroid plexus, cr: cartilage primordium of ribs, dt: dorsum of tongue, fv: fourth ventricle, hb: cartilage primordium of body of hyoid bone, li: liver, ll: lower lip, ls: lumen of stomach, lu: lung, mb: main bronchus, mc: mucosal lining, ml: marginal layer of spinal cord, mt: muscle mass of the tongue, nc: neocortex, oe: olfactory epithelium, or: optic recess of diencephalon, os: osteoblasts, pc: pericardial cavity, pe: perichondrium, pl: pleural cavity, pm: pons-midbrain junction, rg: root ganglion, sb: segmental bronchus, sc: spinal cord, sm: submucosa, st: stomach, tb: cartilage primordium of turbinate bones, tp: tooth primordium, ul: upper lip, vc: vena cava. Scale bars: 100 μm.

