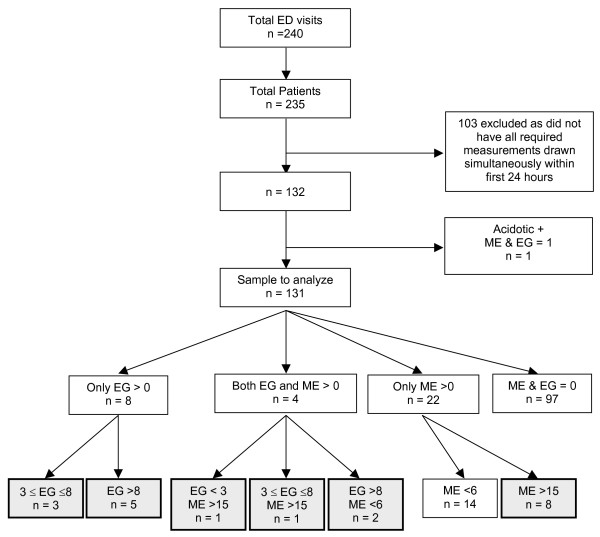
Figure 1.
Flow diagram outlining the derivation of the final study sample. Shaded boxes represent patients considered to be 'exposed' (i.e. ethylene glycol or methanol serum concentrations exceeding the threshold for antidotal therapy). Legend: All concentrations expressed as mmol/l. EG = ethylene glycol ME = methanol

