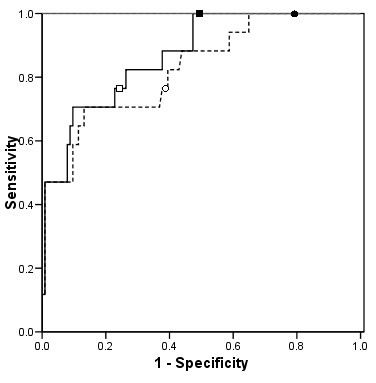
Figure 3.

Receiver Operator Characteristics curves for the two equations when used to identify patients with serum concentrations of ethylene glycol and methanol that exceed the threshold at which hemodialysis is recommended
- - - - osmole gap derived using equation 1 (ethanol coefficient of 1)
----- osmole gap derived using equation 2 (ethanol coefficient of 1.25).
The points delineated by ● and ■ indicate an osmole gap cut-off of 10 derived using equations 1 and 2, respectively. The points delineated by ○ and □ indicate an osmole gap cut-off of 20 derived using equations 1 and 2, respectively.
