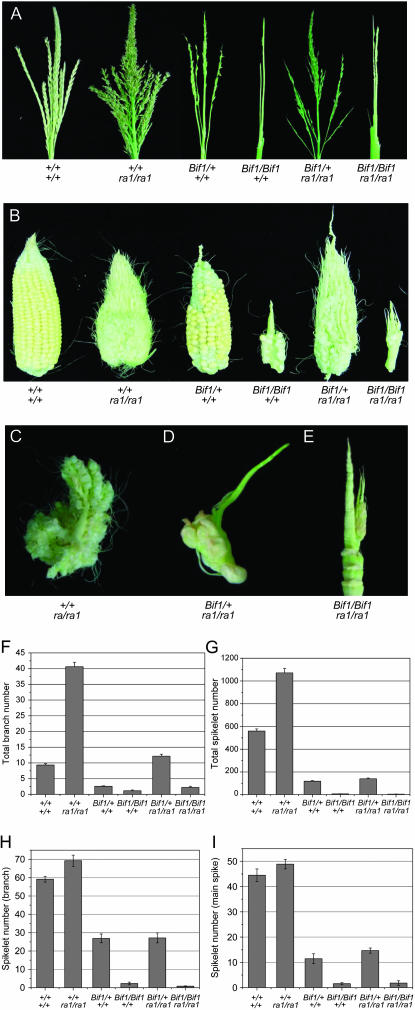
Figure 4.—
Analysis of Bif1; ra1 double mutants. (A) Mature tassel phenotype showing all genetic classes from a segregating Bif1; ra1 family. (B) Ear phenotype of a segregating Bif1; ra1 family. (C–E) Higher-magnification images showing individual branches from ears. (C) Branch from a ra1/ra1 ear. (D) Branch from a Bif1/+; ra1/ra1 ear. (E) Bif1/Bif1; ra1/ra1 ear. (F–I) Quantitative analysis of Bif1; ra1 double mutants. For all charts, bars represent mean value of the data set, and error bars represent standard error of the mean. (F) Average number of branches per tassel. (G) Average number of spikelets per tassel. (H) Average number of spikelets per branch, measured on a branch at the base of the tassel. (I) Average number of spikelets in the top 2 cm of the tassel main spike.

