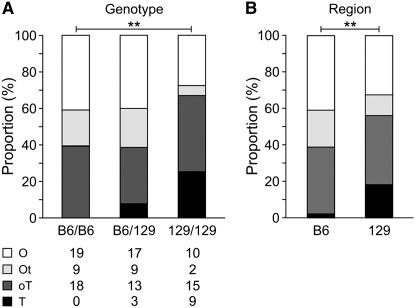
Figure 5.—
Embryo gonad analysis. (A) Gonad distribution by genotype of chromosome 11. The overall comparison of gonad type distribution among the three genotypes using Fisher's exact test resulted in a P-value = 0.004. The largest difference was observed between the B6/B6 and 129/129 homozygotes (**) (P-value = 0.001). (B) Gonad distribution by region of chromosome 11. Using a multiplicative model, the B6 and 129 regions were also found to be different with respect to gonad type distribution (**) (P-value = 0.001). Similar results were obtained when the gonad categories were treated as ordinal rather than categorical.

