Figure 3.—
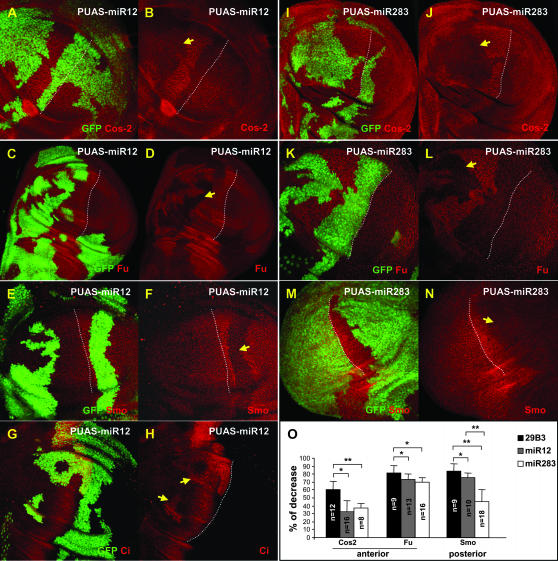
Overexpression of miR-12 or miR-283 modifies the levels of Cos2, Fu, Smo, and Ci proteins. Clones of cells driving expression of PUAS-miR12 (A–H) or PUAS-miR283 (I–L) are labeled with GFP. Cos2 (A, B, I, and J), Fu (C, D, K, and L), Smo (E, F, M, and N), and Ci (G and H) proteins are visualized by immunofluorescence (red). Induction of microRNA expression decreases the level of Fu, Cos2, and Smo proteins in both anterior and posterior clones, whereas Ci is stabilized in anterior clones. Dotted lines indicate the A/P border. Arrows indicate the most significant clones. Note that the antibody against Cos2 gives a higher background than the one against Fu, which likely accounts for the seemingly stronger affects on Fu than on Cos2. (O) Percentage of the decrease in the levels of Cos2, Fu, and Smo proteins in PUAS-29B3 (solid bars), PUAS-miR12 (shaded bars), or PUAS-miR283 (open bars) clones compared to surrounding wild-type cells. In PUAS-29B3 clones, the decrease in Cos2 and Fu levels is more pronounced than in PUAS-miR12 or PUAS-miR283 clones. **P < 0.001; *P < 0.04.

