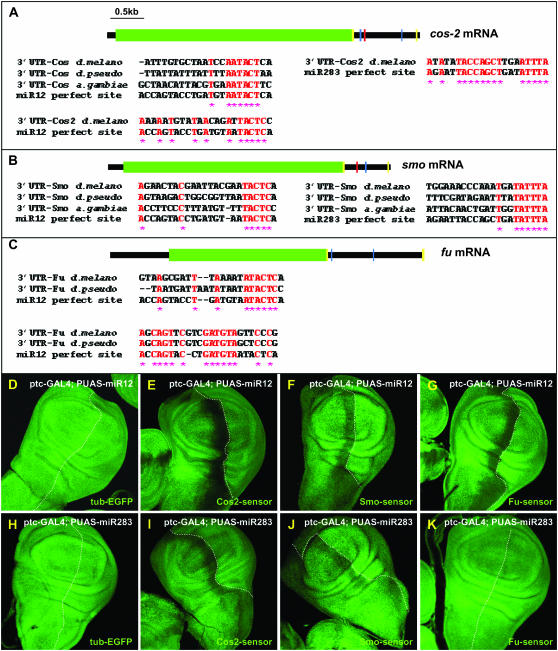
Figure 4.—
smo, cos2, and fu mRNAs are regulated by the 29B3-microRNA cluster. Schematics of cos2 (A), smo (B), and fu (C) mRNAs. Green squares indicate the open reading frames of the transcripts. Blue and red bars represent potential 3′-UTR binding sites for miR-12 and miR-283, respectively. Each site is presented below, showing the conservation between Drosophila pseudoobscura and Anopheles gambiae and theoretical miR-12 or miR-283 binding sites. Conserved residues are shaded in red, with stars below. Yellow bars represent the primers used to amplify the 3′-UTR sequences to establish the Cos2-, Smo-, and Fu-sensor lines. (D–K) GFP expression in tub-EGFP (D and H), Cos2- (E and I), Smo- (F and J), and Fu- (G and K) sensor lines in ptc-GAL4/UAS-miR12 imaginal discs (D–G) or in ptc-GAL4/UAS-miR283 (H–K) wing imaginal discs. Note that no modifications in EGFP expression were observed when miR-12 or miR-283 were overexpressed in the tub-EGFP control line (D and H).

