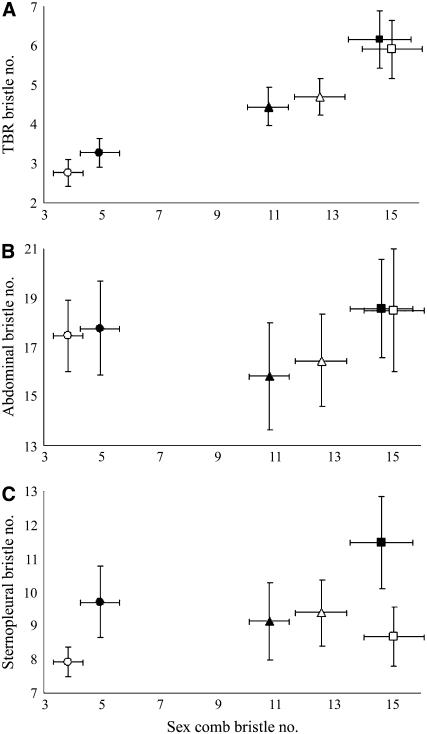
Figure 3.—
Correlated responses to divergent selection for sex comb bristle number. Mean sex comb bristle numbers are plotted against (A) mean female distal TBR bristle numbers, (B) mean male abdominal bristle numbers, and (C) mean male sternopleural bristle numbers of high (square), low (circle), and control (triangle) lines at generation 24 in replicate 1 (open) and replicate 2 (solid). Error bars represent standard deviation.

