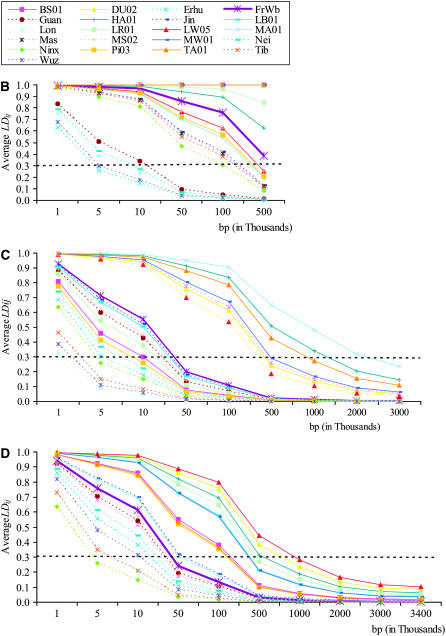
Figure 2.—
Predicted LD and physical distance in the three genomic regions. (A) For each genomic region, the relationship between average predicted LD (LDij) and genomic distance (bp) is shown per biogeographical region. Vertical bars represent the standard error. The relationship between predicted LD (LDij) and distance (base pairs) is shown per breed and per genomic region: target 1 (B), target 2 (C), and target 4 (D). Chinese breeds are represented by dashed lines, European breeds are represented by solid lines, and wild boar is represented by a thick solid line. In target 1, observed r2 is 1 for breeds Tamworth, Duroc, Middle White British Saddleback, and Large Black. Therefore predicted values were not estimated for these breeds and B shows observed r2.


